## Area Chart: Packages Introduced Over Time
### Overview
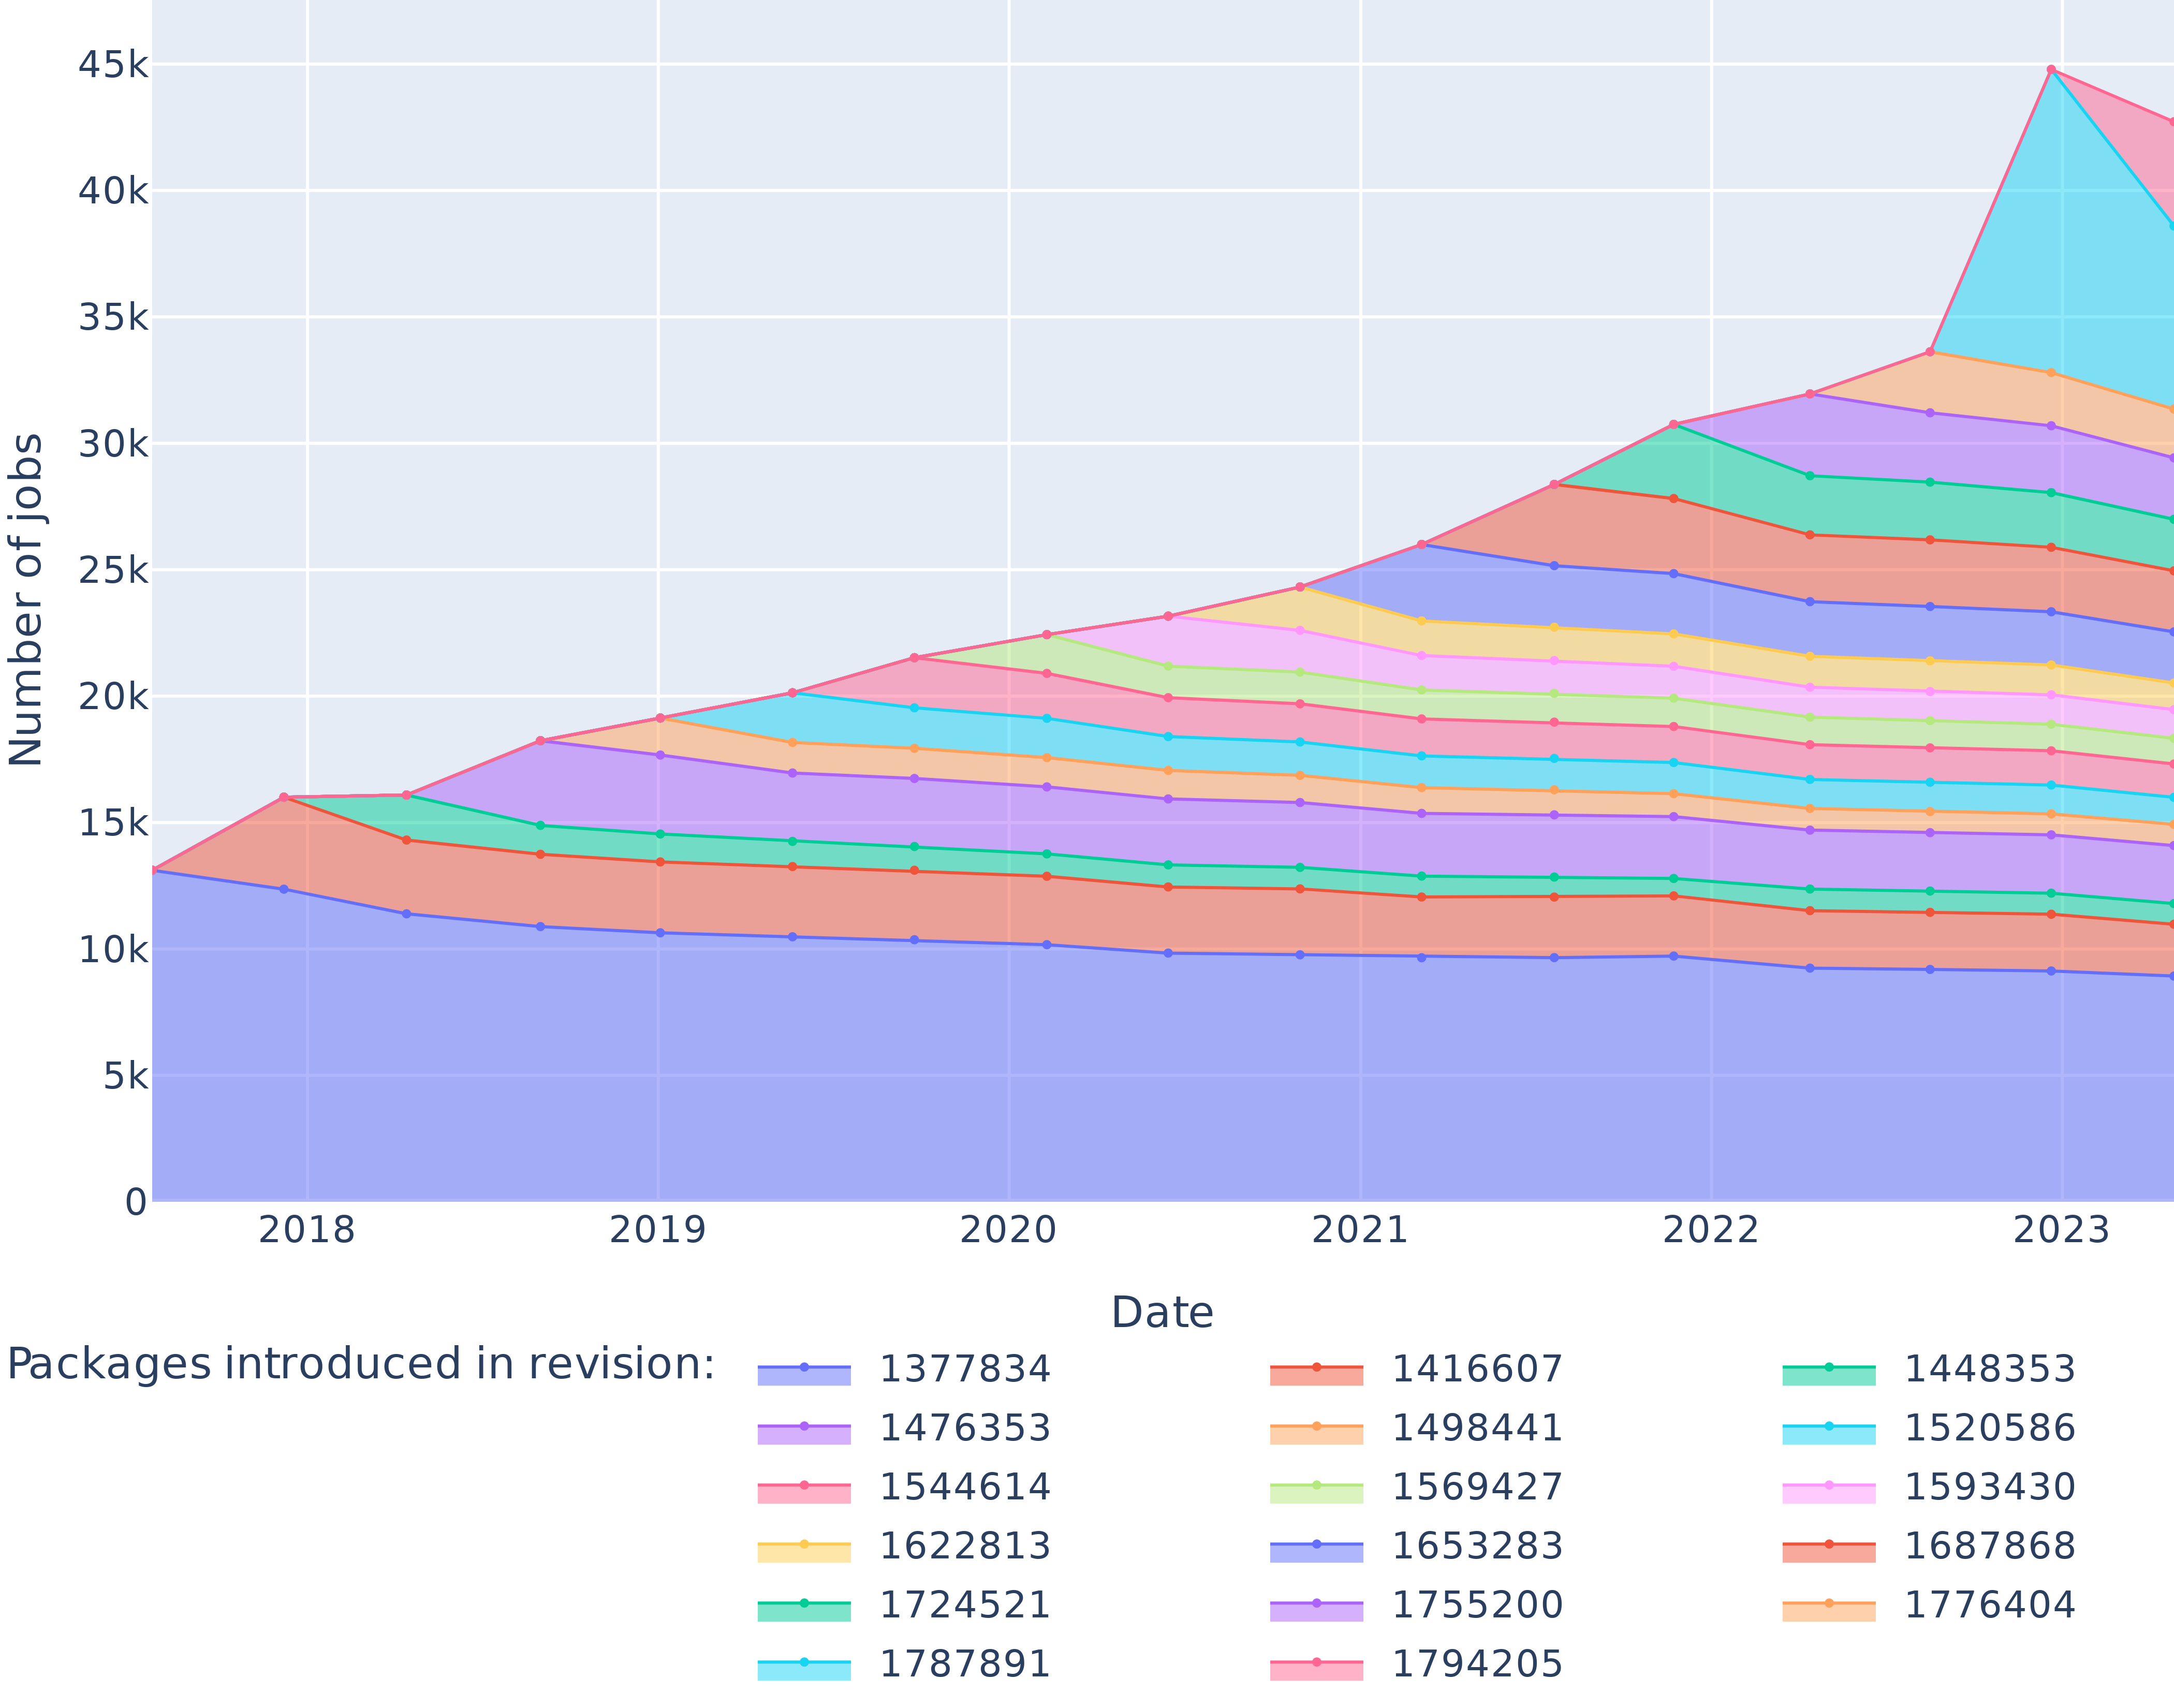
The image is an area chart displaying the number of jobs over time, broken down by packages introduced in different revisions. The x-axis represents the date from 2018 to 2023, and the y-axis represents the number of jobs, ranging from 0 to 45k. Each colored area represents a different package revision, as indicated in the legend.
### Components/Axes
* **Title:** None explicitly present in the image.
* **X-Axis:**
* Label: "Date"
* Scale: 2018, 2019, 2020, 2021, 2022, 2023
* **Y-Axis:**
* Label: "Number of jobs"
* Scale: 0, 5k, 10k, 15k, 20k, 25k, 30k, 35k, 40k, 45k
* **Legend:** Located at the bottom of the chart.
* Title: "Packages introduced in revision:"
* Entries:
* Blue: 1377834
* Purple: 1476353
* Pink: 1544614
* Yellow: 1622813
* Teal: 1724521
* Light Blue: 1787891
* Red: 1416607
* Orange: 1498441
* Green: 1569427
* Dark Blue: 1653283
* Light Purple: 1755200
* Light Pink: 1794205
* Dark Teal: 1448353
* Cyan: 1520586
* Salmon: 1593430
* Coral: 1687868
* Peach: 1776404
### Detailed Analysis
* **Package 1377834 (Blue):** Starts at approximately 13k in 2018, decreases to around 10k by 2023.
* **Package 1476353 (Purple):** Starts at approximately 15k in 2018, increases to around 18k by 2023.
* **Package 1544614 (Pink):** Starts at approximately 16k in 2018, increases to around 20k by 2023.
* **Package 1622813 (Yellow):** Starts at approximately 16k in 2018, decreases to around 14k by 2023.
* **Package 1724521 (Teal):** Starts at approximately 16k in 2018, decreases to around 14k by 2023.
* **Package 1787891 (Light Blue):** Starts at approximately 16k in 2018, increases to around 20k by 2023.
* **Package 1416607 (Red):** Starts at approximately 13k in 2018, decreases to around 12k by 2023.
* **Package 1498441 (Orange):** Starts at approximately 16k in 2018, decreases to around 14k by 2023.
* **Package 1569427 (Green):** Starts at approximately 13k in 2018, decreases to around 12k by 2023.
* **Package 1653283 (Dark Blue):** Starts at approximately 13k in 2018, decreases to around 10k by 2023.
* **Package 1755200 (Light Purple):** Starts at approximately 16k in 2018, increases to around 18k by 2023.
* **Package 1794205 (Light Pink):** Starts at approximately 16k in 2018, increases to around 20k by 2023.
* **Package 1448353 (Dark Teal):** Starts at approximately 13k in 2018, decreases to around 12k by 2023.
* **Package 1520586 (Cyan):** Starts at approximately 16k in 2018, increases to around 45k by 2023.
* **Package 1593430 (Salmon):** Starts at approximately 16k in 2018, increases to around 20k by 2023.
* **Package 1687868 (Coral):** Starts at approximately 16k in 2018, increases to around 18k by 2023.
* **Package 1776404 (Peach):** Starts at approximately 16k in 2018, increases to around 18k by 2023.
### Key Observations
* The total number of jobs increases significantly from 2018 to 2023.
* Some packages (e.g., 1377834, 1653283) show a decreasing trend in the number of jobs over time.
* Other packages (e.g., 1476353, 1544614, 1787891, 1755200, 1794205, 1593430, 1687868, 1776404) show an increasing trend in the number of jobs over time.
* Package 1520586 (Cyan) shows the most significant increase in the number of jobs, especially in 2023.
### Interpretation
The area chart illustrates the evolution of job numbers associated with different package revisions over a 5-year period. The increasing total number of jobs suggests overall growth or increased activity. The varying trends among different packages indicate that some revisions may have become less relevant or efficient over time (decreasing trends), while others have gained more traction or utility (increasing trends). The substantial growth of package 1520586 suggests a particularly successful or widely adopted revision. The data could be used to inform decisions about package maintenance, resource allocation, and future development efforts.