\n
## Line Chart: Number of Jobs Over Time by Revision Package
### Overview
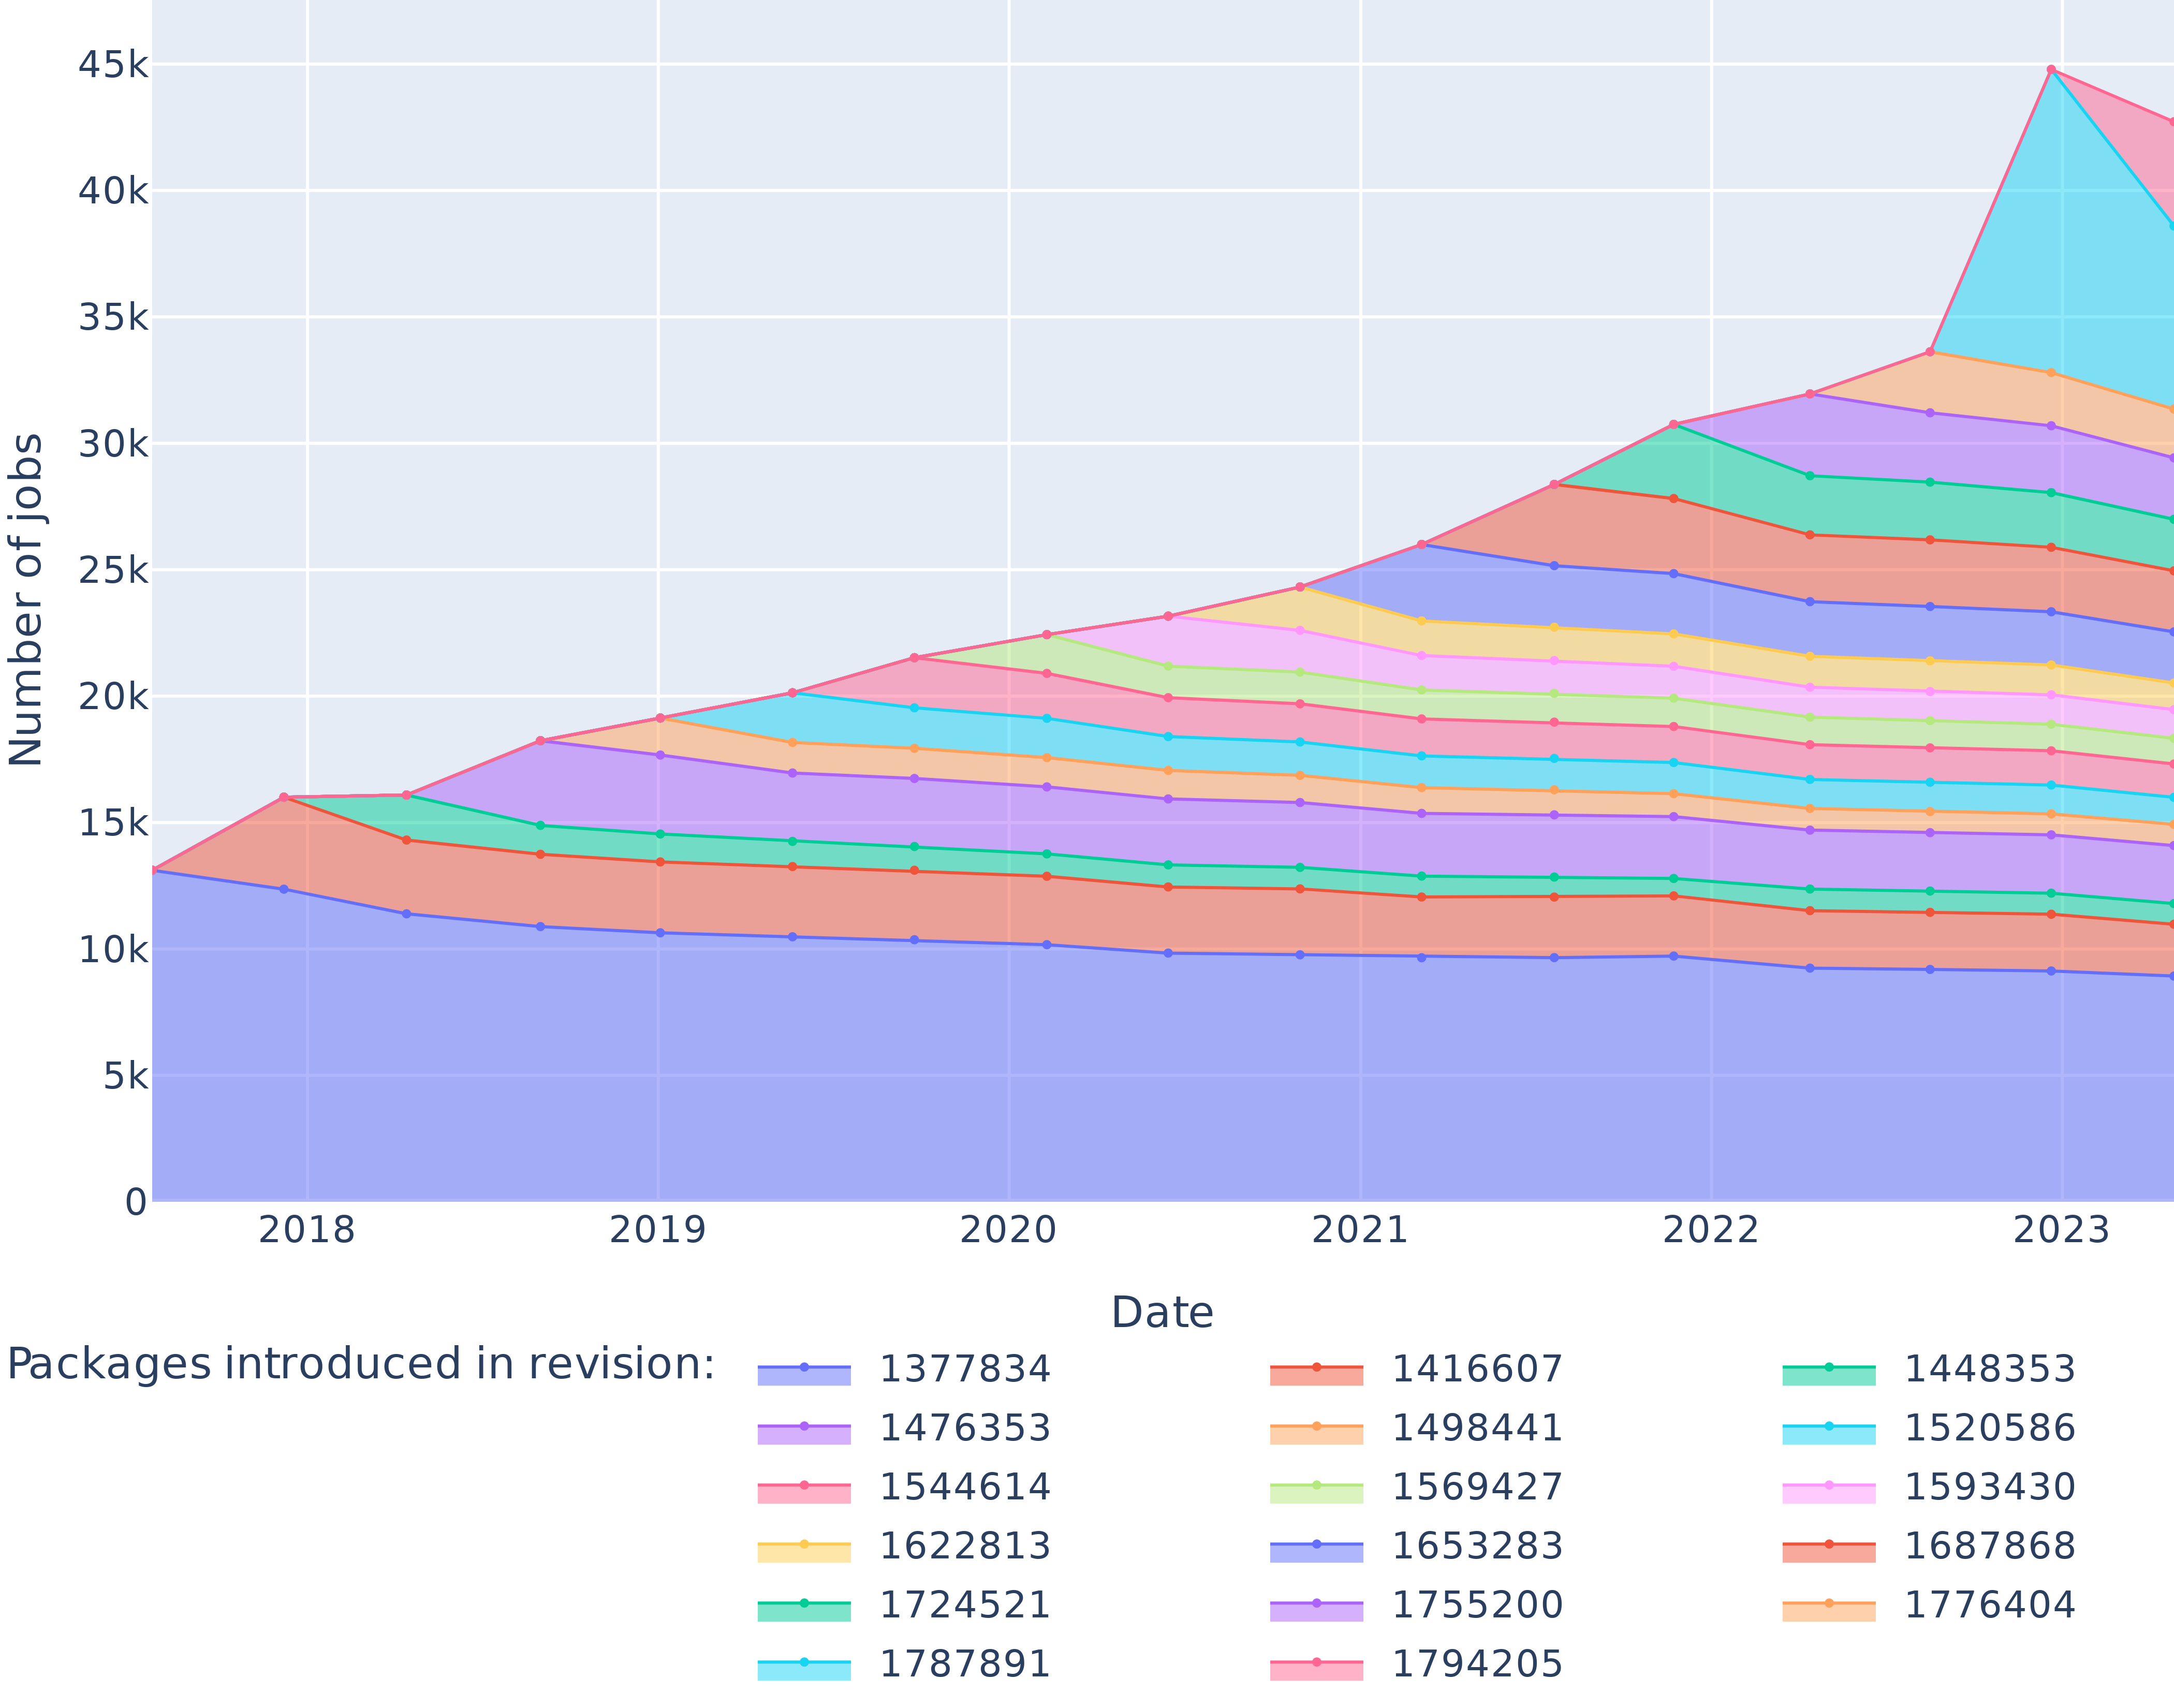
This image presents a line chart illustrating the number of jobs over time (from 2018 to 2023) for different revision packages. The chart displays multiple lines, each representing a specific package, showing how the number of jobs associated with that package changes over the years. The y-axis represents the "Number of Jobs" in thousands (k), and the x-axis represents the "Date" from 2018 to 2023. A legend at the bottom identifies each line by its corresponding revision package number.
### Components/Axes
* **X-axis:** "Date" ranging from 2018 to 2023, with tick marks at each year.
* **Y-axis:** "Number of Jobs" ranging from 0 to 45k, with tick marks at 5k intervals.
* **Legend:** Located at the bottom of the chart, listing the following revision packages with corresponding colors:
* 1377834 (Red)
* 1416607 (Orange)
* 1448353 (Green)
* 1476353 (Purple)
* 1498441 (Yellow)
* 1520586 (Cyan)
* 1544614 (Light Green)
* 1569427 (Blue)
* 1593430 (Magenta)
* 1622813 (Brown)
* 1653283 (Gray)
* 1687868 (Dark Red)
* 1724521 (Teal)
* 1755200 (Violet)
* 1776404 (Pink)
* 1787891 (Olive)
* 1794205 (Coral)
### Detailed Analysis
Here's a breakdown of the trends and approximate data points for each line, verified against the legend colors:
* **1377834 (Red):** The line starts at approximately 16k jobs in 2018, gradually increases to around 22k in 2020, then rises sharply to approximately 32k in 2022, and finally reaches around 35k in 2023.
* **1416607 (Orange):** Starts at around 14k jobs in 2018, increases to approximately 18k in 2020, then rises to around 25k in 2022, and ends at approximately 28k in 2023.
* **1448353 (Green):** Begins at approximately 11k jobs in 2018, steadily increases to around 16k in 2020, then rises to approximately 23k in 2022, and finishes at around 26k in 2023.
* **1476353 (Purple):** Starts at around 12k jobs in 2018, increases to approximately 17k in 2020, then rises to around 24k in 2022, and ends at approximately 27k in 2023.
* **1498441 (Yellow):** Begins at approximately 13k jobs in 2018, increases to around 17k in 2020, then rises to approximately 23k in 2022, and finishes at around 26k in 2023.
* **1520586 (Cyan):** Starts at around 11k jobs in 2018, increases to approximately 15k in 2020, then rises to around 21k in 2022, and ends at approximately 24k in 2023.
* **1544614 (Light Green):** Begins at approximately 12k jobs in 2018, increases to around 16k in 2020, then rises to approximately 22k in 2022, and finishes at around 25k in 2023.
* **1569427 (Blue):** Starts at around 13k jobs in 2018, increases to approximately 17k in 2020, then rises to approximately 23k in 2022, and ends at approximately 26k in 2023.
* **1593430 (Magenta):** Begins at approximately 11k jobs in 2018, increases to around 15k in 2020, then rises to approximately 21k in 2022, and finishes at around 24k in 2023.
* **1622813 (Brown):** Starts at around 12k jobs in 2018, increases to approximately 16k in 2020, then rises to approximately 22k in 2022, and ends at approximately 25k in 2023.
* **1653283 (Gray):** Begins at approximately 13k jobs in 2018, increases to around 17k in 2020, then rises to approximately 23k in 2022, and finishes at around 26k in 2023.
* **1687868 (Dark Red):** Starts at around 12k jobs in 2018, increases to approximately 16k in 2020, then rises to approximately 22k in 2022, and ends at approximately 25k in 2023.
* **1724521 (Teal):** Begins at approximately 11k jobs in 2018, increases to around 15k in 2020, then rises to approximately 21k in 2022, and finishes at around 24k in 2023.
* **1755200 (Violet):** Starts at around 12k jobs in 2018, increases to approximately 16k in 2020, then rises to approximately 22k in 2022, and ends at approximately 25k in 2023.
* **1776404 (Pink):** Begins at approximately 13k jobs in 2018, increases to around 17k in 2020, then rises to approximately 23k in 2022, and finishes at around 26k in 2023.
* **1787891 (Olive):** Starts at around 12k jobs in 2018, increases to approximately 16k in 2020, then rises to approximately 22k in 2022, and ends at approximately 25k in 2023.
* **1794205 (Coral):** Begins at approximately 11k jobs in 2018, increases to around 15k in 2020, then rises to approximately 21k in 2022, and finishes at around 24k in 2023.
### Key Observations
* There's a general upward trend for most packages from 2018 to 2023.
* The most significant growth is observed between 2020 and 2023.
* Package 1377834 (Red) consistently shows the highest number of jobs throughout the period.
* Several packages (e.g., 1448353, 1476353, 1498441) exhibit very similar trends, suggesting they might be related or affected by the same factors.
* The lines representing the different packages converge towards the end of the period (2022-2023), indicating a potential saturation point or a shift in job distribution.
### Interpretation
The chart demonstrates a clear increase in the number of jobs associated with various revision packages over the six-year period. This could indicate growing adoption of these packages, increased development activity, or a general expansion of the system or platform they relate to. The consistent lead of package 1377834 suggests it is a core or widely used component. The convergence of lines towards 2023 might signify that the growth rate is slowing down, or that new packages are emerging and attracting a share of the jobs. The similar trends among several packages suggest they are likely interdependent or part of a common workflow. Further investigation would be needed to understand the specific reasons behind these trends and the relationships between the packages. The data suggests a healthy and evolving system, but the slowing growth rate warrants monitoring to ensure continued progress.