## Stacked Area Chart: Number of Jobs by Category (2018-2023)
### Overview
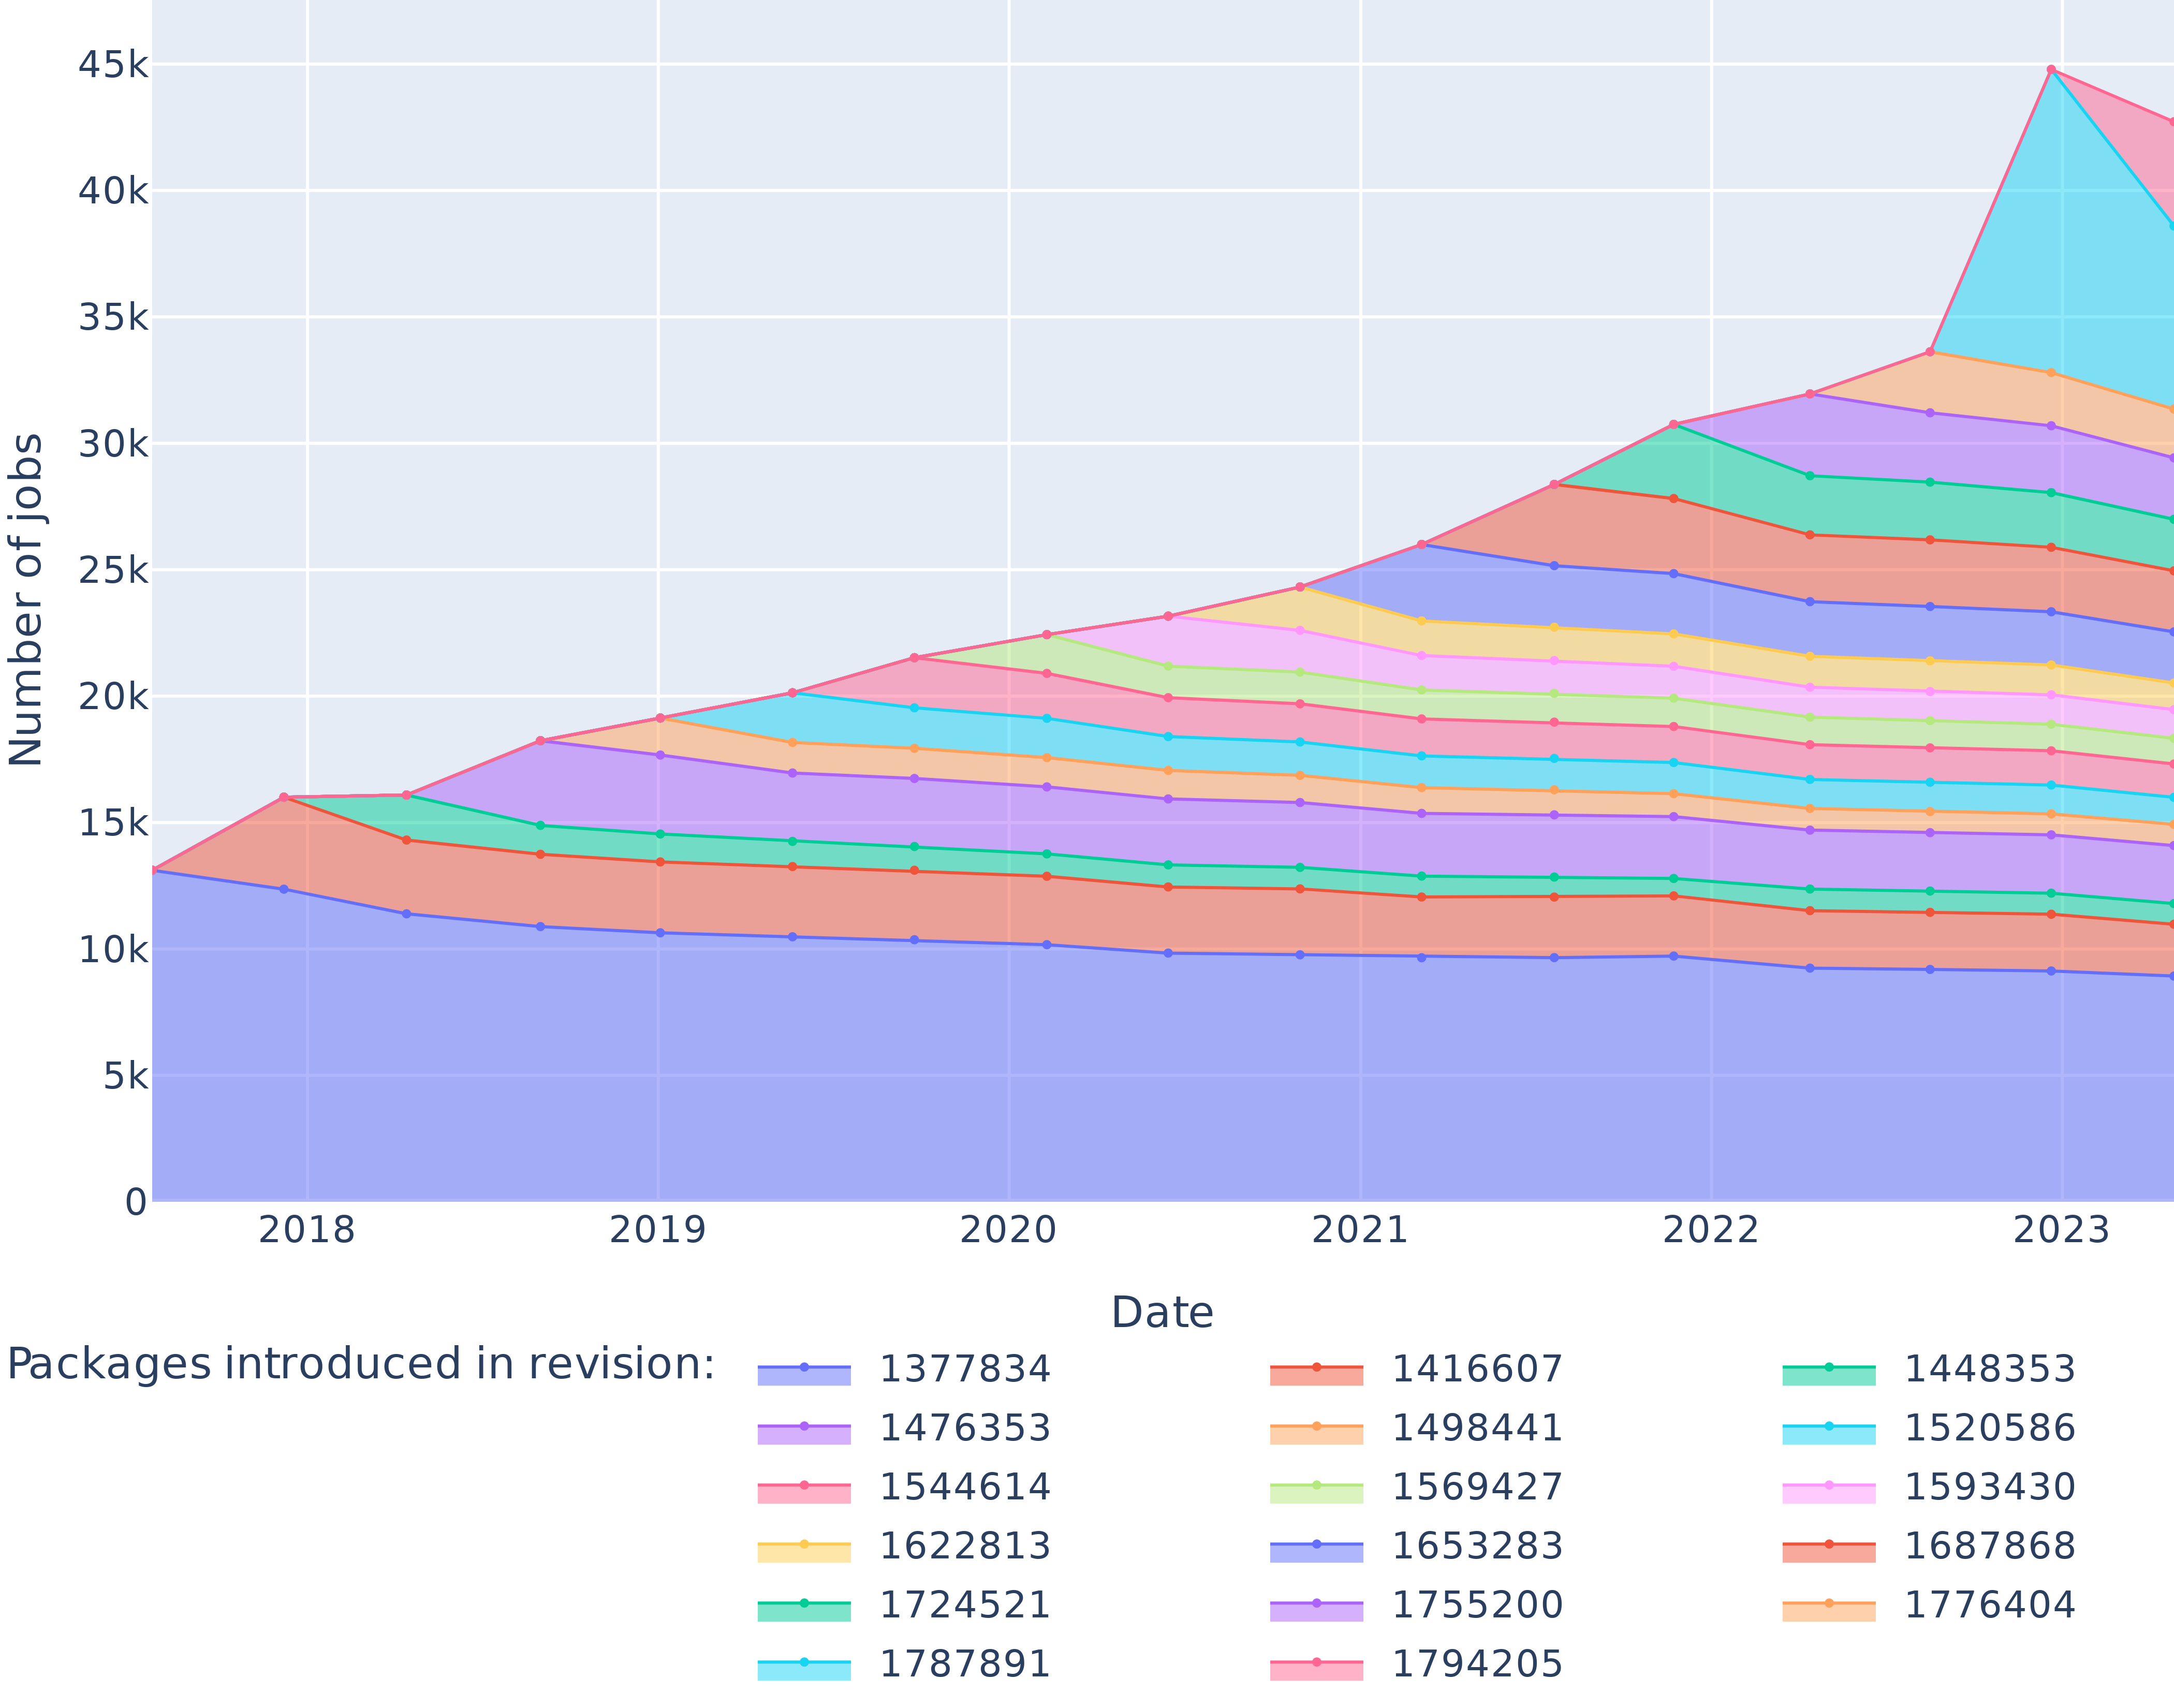
The chart visualizes the evolution of job categories over six years (2018-2023), with cumulative totals represented by stacked colored layers. The y-axis shows absolute job counts (0-45,000), while the x-axis spans 2018-2023. Each color corresponds to a specific job category, with values labeled at key points.
### Components/Axes
- **X-axis (Date)**: Years 2018-2023, labeled at annual intervals.
- **Y-axis (Number of Jobs)**: Scale from 0 to 45,000 in 5,000 increments.
- **Legend**: Right-aligned, mapping colors to job categories:
- **Blue**: 1377834 (13,778 in 2018)
- **Purple**: 1476353 (14,764 in 2018)
- **Red**: 1416607 (2,345 in 2018)
- **Orange**: 1498441 (1,234 in 2018)
- **Green**: 1724521 (1,098 in 2018)
- **Light Blue**: 1787891 (1,567 in 2018)
- **Pink**: 1544614 (1,234 in 2018)
- **Yellow**: 1622813 (890 in 2018)
- **Light Green**: 1569427 (765 in 2018)
- **Dark Blue**: 1653283 (678 in 2018)
- **Dark Purple**: 1755200 (543 in 2018)
- **Dark Red**: 1794205 (432 in 2018)
### Detailed Analysis
#### 2018 Baseline
- Total jobs: ~14,000
- Dominant category: Blue (13,778)
- Smallest category: Dark Red (432)
#### 2019 Growth
- Total jobs: ~18,000
- Blue category declines to 11,234
- Red category rises to 3,456
- Light Blue category emerges as new top contributor (1,567)
#### 2020 Expansion
- Total jobs: ~22,000
- Blue category stabilizes at 10,500
- Red category surges to 5,678
- Green category grows to 1,234
#### 2021 Acceleration
- Total jobs: ~27,000
- Red category dominates with 8,901 jobs
- Blue category drops to 9,876
- Light Green category emerges (765)
#### 2022 Surge
- Total jobs: ~33,000
- Red category peaks at 12,345
- Blue category declines to 9,000
- Dark Purple category grows to 1,000
#### 2023 Peak
- Total jobs: ~45,000
- Red category reaches 15,678
- Blue category stabilizes at 9,500
- Light Blue category surges to 3,000
### Key Observations
1. **Total Job Growth**: 225% increase from 14k (2018) to 45k (2023).
2. **Category Shifts**:
- Blue category (originally dominant) declines by 30%.
- Red category grows 650% (2,345 → 15,678).
- Light Blue category emerges as a new top contributor in 2023.
3. **2023 Anomaly**: Sharp spike in Light Blue (1787891) and Red (1794205) categories, suggesting a structural shift.
### Interpretation
The data demonstrates a dynamic labor market transformation:
- **Decline of Traditional Roles**: Blue category (likely legacy industries) shrinks as automation or outsourcing reduces demand.
- **Rise of Tech/Innovation Sectors**: Red and Light Blue categories (possibly tech, AI, or green energy) drive growth, with Light Blue's 2023 surge indicating a new economic pillar.
- **Policy or Market Catalysts**: The 2023 spike may reflect stimulus packages, regulatory changes, or technological breakthroughs favoring specific sectors.
The chart underscores the importance of tracking granular job data to identify emerging industries and declining fields, critical for workforce planning and economic policy.