## Line Graph: response_length/mean
### Overview
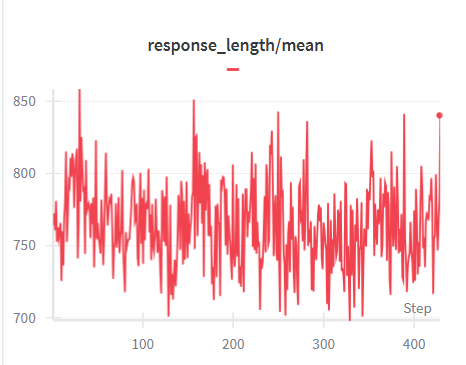
The image depicts a line graph titled "response_length/mean," showing the relationship between "Step" (x-axis) and "response_length/mean" (y-axis). The red line fluctuates significantly across the x-axis range (0–400), with peaks and troughs indicating variability in the measured metric. The graph includes a legend confirming the red line represents "response_length/mean."
### Components/Axes
- **Title**: "response_length/mean" (centered at the top).
- **X-axis**: Labeled "Step," with numerical markers at 0, 100, 200, 300, and 400.
- **Y-axis**: Labeled "response_length/mean," with numerical markers at 700, 750, 800, 850.
- **Legend**: Positioned at the top, with a red line labeled "response_length/mean."
- **Line**: A single red line with sharp fluctuations, no shading or additional data series.
### Detailed Analysis
- **Trend**: The red line exhibits high volatility, with no clear linear or exponential pattern.
- **Peaks**: Reaches approximately **850** at Step 400 (rightmost point).
- **Troughs**: Drops to around **700** at Step 300 (midpoint).
- **Mid-range**: Most values cluster between **750–800**, with occasional spikes above 800 and dips below 750.
- **Key Data Points**:
- Step 0: ~760
- Step 100: ~780
- Step 200: ~790
- Step 300: ~700 (minimum observed)
- Step 400: ~850 (maximum observed)
### Key Observations
1. **High Variability**: The metric fluctuates dramatically, suggesting inconsistent or dynamic behavior in the measured response lengths.
2. **Extreme Values**: The maximum (850) and minimum (700) values occur at the endpoints (Steps 400 and 300), respectively.
3. **Midpoint Dip**: A notable trough at Step 300, potentially indicating a temporary anomaly or system adjustment.
### Interpretation
The graph demonstrates that response lengths vary unpredictably across steps, with no consistent trend. The sharp dip at Step 300 and peak at Step 400 suggest external factors or system changes influencing the metric. The high variability could imply:
- **Unstable Conditions**: Environmental or operational factors affecting response times.
- **Data Noise**: Measurement errors or outliers skewing the mean.
- **Phase Transitions**: A critical event at Step 300 (e.g., system reset) and a stabilization phase leading to the peak at Step 400.
The absence of a clear pattern highlights the need for further investigation into the underlying causes of these fluctuations.