\n
## Bar Chart: Causal Attribution: The Impact of Exogenous "Luck"
### Overview
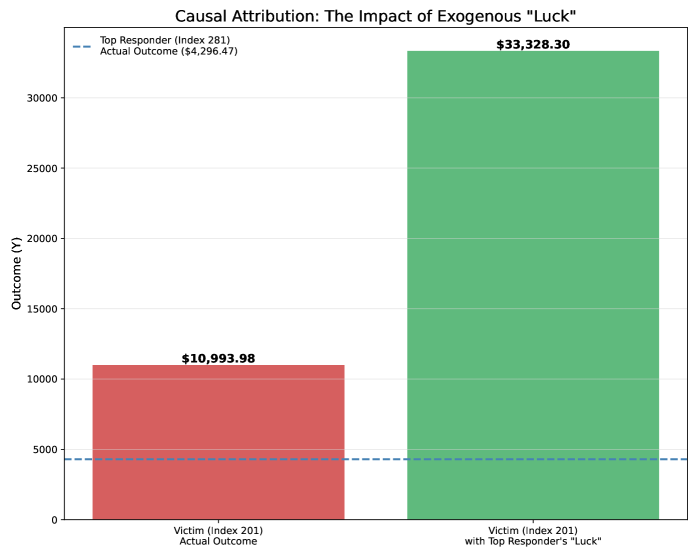
This bar chart compares the "Actual Outcome" for a "Victim (Index 201)" to the outcome when the victim benefits from the "Luck" of a "Top Responder (Index 281)". The chart visually demonstrates a significant positive impact of the responder's "Luck" on the victim's outcome.
### Components/Axes
* **Title:** Causal Attribution: The Impact of Exogenous "Luck"
* **X-axis Label:** Categorical, representing the two conditions: "Victim (Index 201) Actual Outcome" and "Victim (Index 201) with Top Responder’s “Luck”"
* **Y-axis Label:** "Outcome (Y)", representing the numerical value of the outcome. The scale ranges from 0 to 35,000.
* **Horizontal Line:** Dashed blue line labeled "Actual Outcome ($4,296.47)". This line represents a specific value on the Y-axis.
* **Bars:** Two vertical bars, one red and one green, representing the outcomes for each condition.
* **Data Labels:** Numerical values displayed above each bar, indicating the outcome amount.
### Detailed Analysis
The chart presents two bars:
1. **Red Bar:** Represents "Victim (Index 201) Actual Outcome". The bar extends to approximately 10,993.98 on the Y-axis. The value displayed above the bar is **$10,993.98**.
2. **Green Bar:** Represents "Victim (Index 201) with Top Responder’s “Luck”". This bar is significantly taller, extending to approximately 33,328.30 on the Y-axis. The value displayed above the bar is **$33,328.30**.
3. **Horizontal Blue Dashed Line:** This line is positioned at approximately 4,296.47 on the Y-axis, and is labeled "Actual Outcome ($4,296.47)".
The green bar is substantially higher than the red bar, indicating a much larger outcome when the victim benefits from the responder's "Luck". The horizontal line appears to represent a baseline or reference point, potentially the outcome without any intervention.
### Key Observations
* The "Luck" of the Top Responder (Index 281) has a dramatic positive effect on the victim's outcome.
* The outcome with "Luck" is more than three times the actual outcome.
* The horizontal line suggests a baseline outcome of $4,296.47, which is lower than both the actual outcome and the outcome with "Luck".
### Interpretation
The chart demonstrates a strong causal relationship between the "Luck" of the Top Responder and the victim's outcome. The data suggests that the responder's intervention or characteristics significantly improve the victim's situation. The horizontal line representing the "Actual Outcome ($4,296.47)" could be interpreted as the outcome in the absence of any external influence or intervention. The large difference between the red bar (actual outcome) and the green bar (outcome with luck) highlights the substantial impact of the exogenous "Luck" factor. The use of the term "Luck" is interesting, as it implies a degree of randomness or chance, but the chart clearly shows a consistent and significant effect. This could be a simplified representation of a more complex mechanism where the responder possesses skills, resources, or connections that lead to better outcomes for the victim. The indices (201 and 281) suggest these are identifiers within a larger dataset or study.