## Loss vs. Tokens Trained Chart: Parameter Variation
### Overview
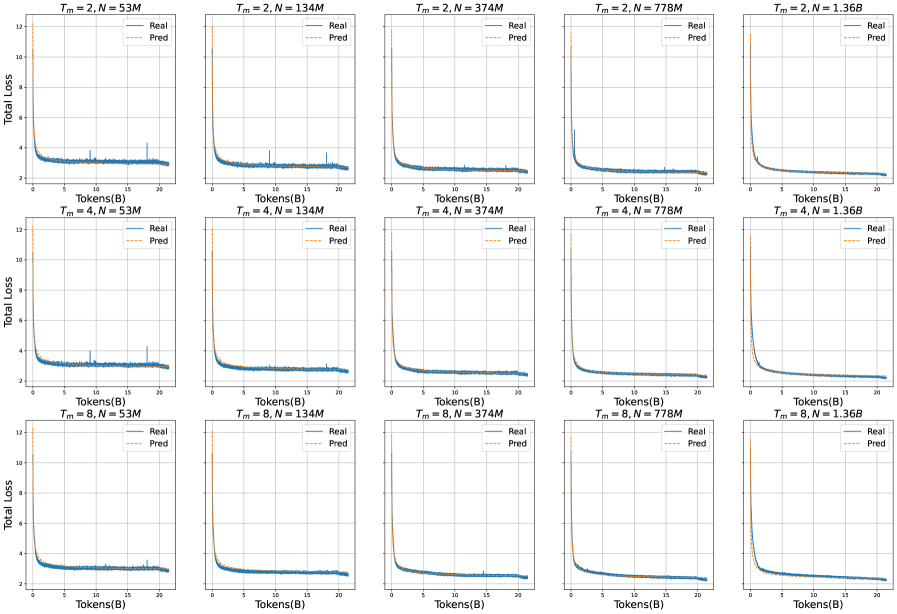
The image presents a grid of line charts, each displaying the "Total Loss" versus "Tokens(B)" (Tokens in Billions) during a training process. The charts are organized in a 3x5 grid, with each chart representing a different combination of parameters: `Tm` (ranging from 2, 4, and 8) and `N` (ranging from 53M, 134M, 374M, 778M, and 1.36B). Each chart shows two lines: "Real" (blue) and "Pred" (orange, dashed). The charts illustrate how the loss function changes as the model trains on more tokens, under different parameter settings.
### Components/Axes
* **X-axis (horizontal):** "Tokens(B)" - Represents the number of tokens trained on, measured in billions. The scale ranges from 0 to 20 in all subplots.
* **Y-axis (vertical):** "Total Loss" - Represents the total loss value. The scale ranges from approximately 2 to 12 in all subplots.
* **Chart Titles:** Each chart has a title in the format "Tm = X, N = Y", where X and Y are numerical values representing the parameters.
* **Legend:** Each chart includes a legend in the top-right corner, indicating "Real" (solid blue line) and "Pred" (dashed orange line).
### Detailed Analysis
The data is presented as a 3x5 grid of plots. Each plot shows the "Real" and "Pred" loss curves for a specific combination of `Tm` and `N`.
**Row 1: Tm = 2**
* **Tm = 2, N = 53M:** The "Real" loss (blue) starts high and rapidly decreases, then plateaus around a value of approximately 2.5. The "Pred" loss (orange, dashed) follows a similar trend, initially overlapping with the "Real" loss, then slightly diverging and plateauing at a slightly higher value.
* **Tm = 2, N = 134M:** Similar to the previous chart, both "Real" and "Pred" losses decrease rapidly and then plateau. The "Real" loss plateaus around 2.5, and the "Pred" loss is slightly higher.
* **Tm = 2, N = 374M:** The "Real" loss decreases rapidly and plateaus around 2.5. The "Pred" loss follows a similar trend.
* **Tm = 2, N = 778M:** The "Real" loss decreases rapidly and plateaus around 2.5. The "Pred" loss follows a similar trend.
* **Tm = 2, N = 1.36B:** The "Real" loss decreases rapidly and plateaus around 2.5. The "Pred" loss follows a similar trend.
**Row 2: Tm = 4**
* **Tm = 4, N = 53M:** The "Real" loss decreases rapidly and plateaus around 2.5. The "Pred" loss follows a similar trend.
* **Tm = 4, N = 134M:** The "Real" loss decreases rapidly and plateaus around 2.5. The "Pred" loss follows a similar trend.
* **Tm = 4, N = 374M:** The "Real" loss decreases rapidly and plateaus around 2.5. The "Pred" loss follows a similar trend.
* **Tm = 4, N = 778M:** The "Real" loss decreases rapidly and plateaus around 2.5. The "Pred" loss follows a similar trend.
* **Tm = 4, N = 1.36B:** The "Real" loss decreases rapidly and plateaus around 2.5. The "Pred" loss follows a similar trend.
**Row 3: Tm = 8**
* **Tm = 8, N = 53M:** The "Real" loss decreases rapidly and plateaus around 2.5. The "Pred" loss follows a similar trend.
* **Tm = 8, N = 134M:** The "Real" loss decreases rapidly and plateaus around 2.5. The "Pred" loss follows a similar trend.
* **Tm = 8, N = 374M:** The "Real" loss decreases rapidly and plateaus around 2.5. The "Pred" loss follows a similar trend.
* **Tm = 8, N = 778M:** The "Real" loss decreases rapidly and plateaus around 2.5. The "Pred" loss follows a similar trend.
* **Tm = 8, N = 1.36B:** The "Real" loss decreases rapidly and plateaus around 2.5. The "Pred" loss follows a similar trend.
### Key Observations
* **Rapid Initial Loss Reduction:** In all charts, both "Real" and "Pred" losses decrease sharply in the initial training phase (first few billion tokens).
* **Plateauing Loss:** After the initial drop, the losses plateau, indicating that the model's performance improvement slows down significantly. The "Real" loss consistently plateaus around a value of approximately 2.5.
* **Parameter Invariance:** The different combinations of `Tm` and `N` do not seem to significantly affect the final plateaued loss value. The loss curves are qualitatively similar across all charts.
* **"Real" vs "Pred" Loss:** The "Pred" loss is consistently slightly higher than the "Real" loss, but the difference is relatively small.
### Interpretation
The charts suggest that the model learns effectively in the initial training phase, as indicated by the rapid decrease in loss. However, the plateauing of the loss indicates that the model's learning capacity might be reaching its limit, or that further training requires different strategies (e.g., adjusting learning rates, changing the model architecture).
The fact that different combinations of `Tm` and `N` do not significantly impact the final loss value suggests that these parameters might not be critical for the model's performance, at least within the tested range. It is possible that other parameters or factors (e.g., data quality, model architecture) have a more significant influence on the model's learning process.
The consistent difference between "Real" and "Pred" loss might indicate a systematic bias in the model's predictions, which could be further investigated.