## Bar Chart: Benchmark Performance Comparison
### Overview
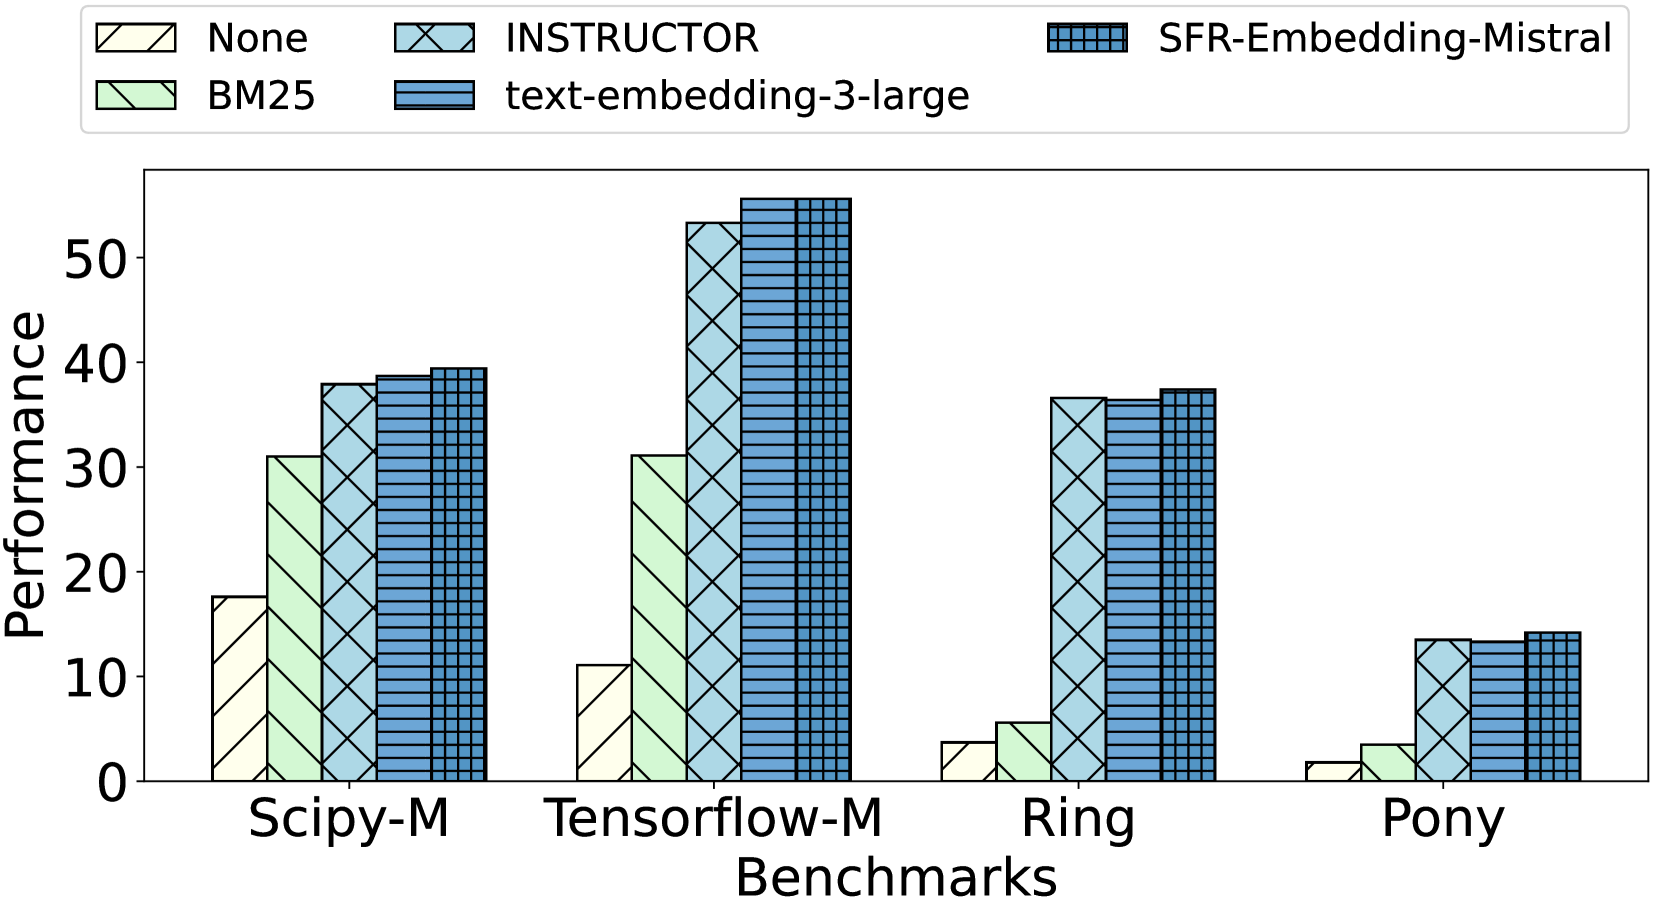
The image is a bar chart comparing the performance of different embedding models across several benchmarks. The chart displays performance scores on the y-axis and benchmark names on the x-axis. Different colored and patterned bars represent different embedding models.
### Components/Axes
* **Y-axis:** "Performance", with a numerical scale from 0 to 50, incrementing by 10.
* **X-axis:** "Benchmarks", with the following categories: Scipy-M, Tensorflow-M, Ring, Pony.
* **Legend:** Located at the top of the chart, it identifies the embedding models represented by different bar colors and patterns:
* None (Pale Yellow with diagonal lines)
* BM25 (Light Green with diagonal lines)
* INSTRUCTOR (Light Blue with cross-hatch pattern)
* text-embedding-3-large (Blue with horizontal lines)
* SFR-Embedding-Mistral (Dark Blue with vertical lines)
### Detailed Analysis
**Scipy-M Benchmark:**
* None: Approximately 18
* BM25: Approximately 31
* INSTRUCTOR: Approximately 38
* text-embedding-3-large: Approximately 39
* SFR-Embedding-Mistral: Approximately 39
**Tensorflow-M Benchmark:**
* None: Approximately 11
* BM25: Approximately 31
* INSTRUCTOR: Approximately 53
* text-embedding-3-large: Approximately 55
* SFR-Embedding-Mistral: Approximately 55
**Ring Benchmark:**
* None: Approximately 4
* BM25: Approximately 6
* INSTRUCTOR: Approximately 36
* text-embedding-3-large: Approximately 37
* SFR-Embedding-Mistral: Approximately 37
**Pony Benchmark:**
* None: Approximately 2
* BM25: Approximately 4
* INSTRUCTOR: Approximately 14
* text-embedding-3-large: Approximately 14
* SFR-Embedding-Mistral: Approximately 14
### Key Observations
* The "SFR-Embedding-Mistral" and "text-embedding-3-large" models consistently achieve the highest performance across all benchmarks.
* The "None" model consistently shows the lowest performance.
* The performance difference between models is most pronounced in the Tensorflow-M benchmark.
* All models perform poorly on the "Pony" benchmark compared to the others.
### Interpretation
The bar chart provides a comparative analysis of different embedding models across various benchmarks. The data suggests that "SFR-Embedding-Mistral" and "text-embedding-3-large" are the most effective models among those tested, as they consistently outperform the others. The significant performance variation across benchmarks indicates that the effectiveness of an embedding model can be highly dependent on the specific task or dataset. The poor performance of all models on the "Pony" benchmark suggests that this benchmark may pose a unique challenge or require a different approach. The "None" model serves as a baseline, demonstrating the performance without any specific embedding technique.