## Scatter Plot: Accuracy vs. Deep-Thinking Ratio for Different Depth Fractions
### Overview
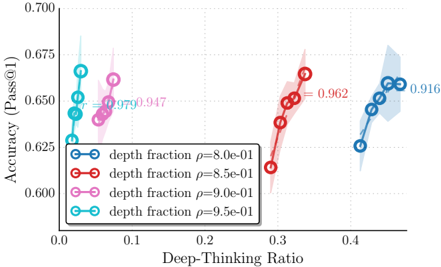
The image is a scatter plot showing the relationship between "Accuracy (Pass@1)" and "Deep-Thinking Ratio" for different "depth fraction" values. The plot includes four data series, each representing a different depth fraction (ρ = 8.0e-01, 8.5e-01, 9.0e-01, and 9.5e-01). Each data series consists of multiple points connected by lines, with shaded regions indicating uncertainty.
### Components/Axes
* **X-axis:** Deep-Thinking Ratio, ranging from 0.0 to 0.45.
* **Y-axis:** Accuracy (Pass@1), ranging from 0.600 to 0.700.
* **Legend (bottom-left):**
* Blue: depth fraction ρ = 8.0e-01
* Red: depth fraction ρ = 8.5e-01
* Pink: depth fraction ρ = 9.0e-01
* Teal: depth fraction ρ = 9.5e-01
### Detailed Analysis
* **Blue Series (depth fraction ρ = 8.0e-01):**
* Trend: Slopes upward.
* Data Points: Approximately (0.41, 0.625), (0.43, 0.650), (0.45, 0.660).
* Value: 0.916 is near the top-right of the blue series.
* **Red Series (depth fraction ρ = 8.5e-01):**
* Trend: Slopes upward.
* Data Points: Approximately (0.29, 0.615), (0.31, 0.645), (0.33, 0.660).
* Value: 0.962 is near the top-right of the red series.
* **Pink Series (depth fraction ρ = 9.0e-01):**
* Trend: Slopes upward.
* Data Points: Approximately (0.06, 0.640), (0.07, 0.650), (0.08, 0.660).
* Values: 0.979 and 0.947 are near the top-right of the pink series.
* **Teal Series (depth fraction ρ = 9.5e-01):**
* Trend: Slopes upward.
* Data Points: Approximately (0.01, 0.625), (0.02, 0.650), (0.03, 0.670).
### Key Observations
* The accuracy generally increases with the deep-thinking ratio for all depth fractions.
* Lower depth fraction values (8.0e-01 and 8.5e-01) are associated with higher deep-thinking ratios.
* Higher depth fraction values (9.0e-01 and 9.5e-01) are associated with lower deep-thinking ratios.
* The shaded regions around each data series indicate some level of uncertainty in the accuracy values.
### Interpretation
The plot suggests that there is a positive correlation between the deep-thinking ratio and accuracy (Pass@1) for the given model. The different depth fractions appear to influence the range of deep-thinking ratios that are achievable. Lower depth fractions require higher deep-thinking ratios to achieve similar levels of accuracy compared to higher depth fractions. The values near the top of each series (0.916, 0.962, 0.979, 0.947) likely represent some performance metric or correlation coefficient associated with each depth fraction. The uncertainty regions indicate the variability in the accuracy for each deep-thinking ratio and depth fraction combination.