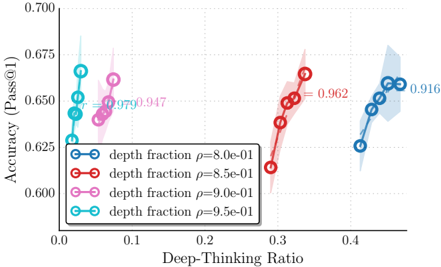
## Scatter Plot: Accuracy vs. Deep-Thinking Ratio
### Overview
This image presents a scatter plot illustrating the relationship between "Deep-Thinking Ratio" and "Accuracy (Pass@1)". Four different data series, labeled "depth fraction" with varying rho (ρ) values, are plotted with confidence intervals. The plot aims to demonstrate how accuracy changes as the deep-thinking ratio is adjusted.
### Components/Axes
* **X-axis:** "Deep-Thinking Ratio", ranging from approximately 0.0 to 0.4.
* **Y-axis:** "Accuracy (Pass@1)", ranging from approximately 0.600 to 0.700.
* **Data Series:** Four lines representing different "depth fraction" values, each distinguished by color and marker style.
* **Blue Line:** ρ = 8.0e-01
* **Red Line:** ρ = 8.5e-01
* **Pink Line:** ρ = 9.0e-01
* **Cyan Line:** ρ = 9.5e-01
* **Legend:** Located in the bottom-left corner, identifying each data series by color and rho value.
* **Confidence Intervals:** Shaded areas around each line, representing the uncertainty in the accuracy measurements.
* **Data Points:** Circles marking the data points for each series.
* **Text Annotations:** Two text annotations indicating accuracy ranges: "0.9790.947" and "0.962" and "0.916".
### Detailed Analysis
Let's analyze each data series individually:
* **Blue Line (ρ = 8.0e-01):** This line starts at approximately (0.0, 0.625) and generally slopes upward, reaching approximately (0.4, 0.695). The confidence interval is relatively narrow.
* **Red Line (ρ = 8.5e-01):** This line begins at approximately (0.0, 0.630) and exhibits a more pronounced upward trend, reaching approximately (0.4, 0.695). The confidence interval is wider than the blue line, especially towards the right.
* **Pink Line (ρ = 9.0e-01):** This line starts at approximately (0.0, 0.635) and shows a similar upward trend to the red line, reaching approximately (0.4, 0.690). The confidence interval is also relatively wide.
* **Cyan Line (ρ = 9.5e-01):** This line begins at approximately (0.0, 0.660) and slopes downward, reaching approximately (0.4, 0.690). The confidence interval is relatively narrow.
The text annotation "0.9790.947" appears to be associated with the pink line, indicating a range of accuracy values. The annotation "0.962" is associated with the red line, and "0.916" with the blue line.
### Key Observations
* The red and pink lines demonstrate a clear positive correlation between Deep-Thinking Ratio and Accuracy, with accuracy increasing as the ratio increases.
* The cyan line shows a negative correlation, with accuracy decreasing as the ratio increases.
* The blue line shows a slight positive correlation.
* The confidence intervals suggest greater uncertainty in the accuracy measurements for the red and pink lines compared to the blue and cyan lines.
* The accuracy values for all lines converge around 0.690-0.695 at a Deep-Thinking Ratio of 0.4.
### Interpretation
The data suggests that the relationship between Deep-Thinking Ratio and Accuracy is not monotonic and is dependent on the "depth fraction" (represented by the rho value). For certain depth fractions (ρ = 8.5e-01 and 9.0e-01), increasing the Deep-Thinking Ratio leads to improved accuracy. However, for other depth fractions (ρ = 9.5e-01), increasing the ratio actually *decreases* accuracy. This indicates an optimal Deep-Thinking Ratio exists for each depth fraction, and exceeding this ratio can be detrimental to performance. The varying widths of the confidence intervals suggest that the impact of the Deep-Thinking Ratio on accuracy is more predictable for some depth fractions than others. The convergence of the lines at higher Deep-Thinking Ratios suggests a potential saturation point where further increases in the ratio yield diminishing returns in accuracy. The annotations highlight specific accuracy ranges achieved at certain points along the curves, providing concrete performance metrics.