TECHNICAL ASSET FINGERPRINT
0060575d59d5e41f7234aa5d
Click to view fullscreen
Press ESC or click to close
FOUND IN PAPERS
EXPERT: healer-alpha-free VERSION 1
RUNTIME: free/openrouter/healer-alpha
INTEL_VERIFIED
## Scatter Plot with Correlation Analysis: Deep-Thinking Ratio vs. Accuracy (Pass@1)
### Overview
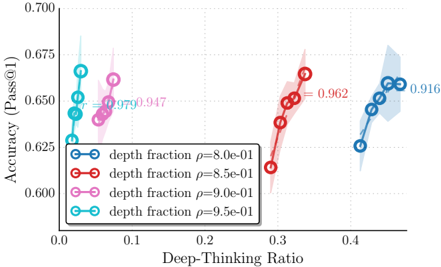
The image is a scatter plot chart displaying the relationship between "Deep-Thinking Ratio" on the x-axis and "Accuracy (Pass@1)" on the y-axis. The data is grouped into four distinct series, each corresponding to a different "depth fraction ρ" value. Each series shows a cluster of data points with an associated linear trend line, error band, and a Pearson correlation coefficient (r). The chart suggests an analysis of how a model's "thinking" depth (ρ) influences the trade-off or relationship between its reasoning depth (Deep-Thinking Ratio) and its performance (Accuracy).
### Components/Axes
* **Chart Type:** Scatter plot with overlaid linear regression lines and confidence/error bands.
* **X-Axis:**
* **Label:** "Deep-Thinking Ratio"
* **Scale:** Linear, ranging from 0.0 to approximately 0.45.
* **Major Ticks:** 0.0, 0.1, 0.2, 0.3, 0.4.
* **Y-Axis:**
* **Label:** "Accuracy (Pass@1)"
* **Scale:** Linear, ranging from 0.600 to 0.700.
* **Major Ticks:** 0.600, 0.625, 0.650, 0.675, 0.700.
* **Legend:**
* **Position:** Bottom-left corner, inside the plot area.
* **Content:** A box listing four data series with corresponding colored markers and labels:
1. Blue circle: `depth fraction ρ=8.0e-01`
2. Red circle: `depth fraction ρ=8.5e-01`
3. Magenta circle: `depth fraction ρ=9.0e-01`
4. Cyan circle: `depth fraction ρ=9.5e-01`
* **Data Series & Annotations:**
* Each series consists of several data points (open circles) connected by a solid line of the same color.
* A semi-transparent shaded band of the corresponding color surrounds each line, likely representing a confidence interval or standard deviation.
* A correlation coefficient (`r =`) is annotated in the same color next to each trend line.
### Detailed Analysis
**1. Blue Series (ρ=8.0e-01):**
* **Spatial Grounding:** Located on the far right of the chart (Deep-Thinking Ratio ~0.41 to 0.45).
* **Trend Verification:** The line shows a clear positive slope, indicating accuracy increases with a higher deep-thinking ratio for this group.
* **Data Points (Approximate):**
* (0.41, 0.627)
* (0.42, 0.645)
* (0.43, 0.650)
* (0.44, 0.655)
* (0.45, 0.660)
* **Annotation:** `r = 0.916` (strong positive correlation).
**2. Red Series (ρ=8.5e-01):**
* **Spatial Grounding:** Located in the center-right of the chart (Deep-Thinking Ratio ~0.29 to 0.33).
* **Trend Verification:** The line shows a very steep positive slope, the steepest among all series.
* **Data Points (Approximate):**
* (0.29, 0.635)
* (0.30, 0.640)
* (0.31, 0.650)
* (0.32, 0.655)
* (0.33, 0.665)
* **Annotation:** `r = 0.962` (very strong positive correlation).
**3. Magenta Series (ρ=9.0e-01):**
* **Spatial Grounding:** Located in the center-left of the chart (Deep-Thinking Ratio ~0.07 to 0.10).
* **Trend Verification:** The line shows a moderate positive slope.
* **Data Points (Approximate):**
* (0.07, 0.640)
* (0.08, 0.645)
* (0.09, 0.650)
* (0.10, 0.655)
* **Annotation:** `r = 0.979` (extremely strong positive correlation).
**4. Cyan Series (ρ=9.5e-01):**
* **Spatial Grounding:** Located on the far left of the chart (Deep-Thinking Ratio ~0.03 to 0.06).
* **Trend Verification:** The line shows a moderate positive slope, similar to the magenta series.
* **Data Points (Approximate):**
* (0.03, 0.635)
* (0.04, 0.645)
* (0.05, 0.655)
* (0.06, 0.660)
* **Annotation:** `r = 0.947` (very strong positive correlation).
### Key Observations
1. **Stratification by ρ:** The data is perfectly stratified by the depth fraction ρ. Higher ρ values (9.0e-01, 9.5e-01) are associated with much lower Deep-Thinking Ratios (<0.10) but achieve comparable or even higher peak accuracy levels than lower ρ values.
2. **Positive Intra-Group Correlation:** Within each ρ group, there is a very strong positive correlation (all r > 0.91) between Deep-Thinking Ratio and Accuracy. More "thinking" within a fixed depth budget improves performance.
3. **Trade-off Across Groups:** There is an apparent trade-off between the *absolute* Deep-Thinking Ratio and the *parameter* ρ. To achieve a high Deep-Thinking Ratio (>0.3), one must use a lower ρ (8.0e-01 or 8.5e-01). Conversely, high ρ values constrain the Deep-Thinking Ratio to a low range.
4. **Performance Clustering:** Despite the vast difference in Deep-Thinking Ratios, all four groups operate within a similar accuracy band (approximately 0.625 to 0.665). The highest individual accuracy points appear in the Cyan (ρ=9.5e-01) and Red (ρ=8.5e-01) series.
### Interpretation
This chart visualizes a key hyperparameter (depth fraction ρ) controlling a model's reasoning behavior. The data suggests:
* **ρ as a Depth Budget Regulator:** The parameter ρ likely controls the proportion of the model's total depth allocated to a "deep thinking" phase. A higher ρ (e.g., 0.95) means 95% of the depth is reserved for this phase, which paradoxically results in a *lower* measured "Deep-Thinking Ratio." This could indicate that with an extremely high reserved budget, the model becomes more efficient or selective, using less of its allocated capacity to achieve high accuracy.
* **Efficiency vs. Effort:** The high-ρ models (magenta, cyan) are more "efficient," achieving top-tier accuracy with a low Deep-Thinking Ratio. The low-ρ models (blue, red) require a much higher ratio of deep thinking to reach similar performance levels, suggesting they are less efficient but can engage in more extensive reasoning when allowed.
* **Optimal Configuration:** The strongest correlation (r=0.979) is found in the ρ=9.0e-01 group, indicating the most predictable and linear relationship between effort (Deep-Thinking Ratio) and outcome (Accuracy) at this setting. The red series (ρ=8.5e-01) shows the steepest gain in accuracy per unit of deep-thinking ratio.
* **Underlying Principle:** The chart demonstrates that model performance is not simply about maximizing a single metric (like Deep-Thinking Ratio). Instead, it's about finding the optimal *configuration* (ρ) that balances internal resource allocation to maximize accuracy. The choice of ρ defines the operational regime of the model.
DECODING INTELLIGENCE...