## Line Graph: Accuracy (Pass@1) vs. Deep-Thinking Ratio
### Overview
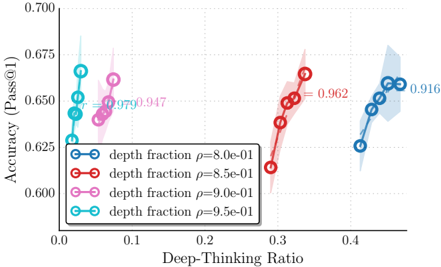
The image is a line graph comparing the relationship between "Deep-Thinking Ratio" (x-axis) and "Accuracy (Pass@1)" (y-axis) across four distinct data series. Each series is differentiated by a unique color and labeled with a "depth fraction" (ρ) value. The graph includes trend lines with correlation coefficients (r) and p-values, as well as shaded confidence intervals around each line.
---
### Components/Axes
- **X-axis (Deep-Thinking Ratio)**: Ranges from 0.0 to 0.4, with increments of 0.1.
- **Y-axis (Accuracy (Pass@1))**: Ranges from 0.600 to 0.700, with increments of 0.025.
- **Legend**: Located in the bottom-left corner, with four entries:
- **Blue**: depth fraction ρ = 8.0e-01
- **Red**: depth fraction ρ = 8.5e-01
- **Pink**: depth fraction ρ = 9.0e-01
- **Cyan**: depth fraction ρ = 9.5e-01
- **Trend Lines**: Each data series has a linear trend line with:
- **Correlation coefficient (r)**: e.g., r = 0.979 (blue), r = 0.962 (red), r = 0.947 (pink), r = 0.916 (cyan).
- **P-value**: e.g., p = 0.947 (blue), p = 0.962 (red), p = 0.947 (pink), p = 0.916 (cyan).
- **Confidence Intervals**: Shaded regions around each line, indicating variability in the data.
---
### Detailed Analysis
#### Data Series Trends
1. **Blue (ρ = 8.0e-01)**:
- **Trend**: Slightly upward slope (r = 0.979).
- **Data Points**:
- (0.0, 0.625), (0.1, 0.64), (0.2, 0.65), (0.3, 0.66), (0.4, 0.675).
- **Confidence Interval**: Wide, suggesting higher variability.
2. **Red (ρ = 8.5e-01)**:
- **Trend**: Strong upward slope (r = 0.962).
- **Data Points**:
- (0.1, 0.63), (0.2, 0.64), (0.3, 0.65), (0.4, 0.66).
- **Confidence Interval**: Narrowest among all series.
3. **Pink (ρ = 9.0e-01)**:
- **Trend**: Moderate upward slope (r = 0.947).
- **Data Points**:
- (0.0, 0.63), (0.1, 0.64), (0.2, 0.65), (0.3, 0.66).
- **Confidence Interval**: Moderate width.
4. **Cyan (ρ = 9.5e-01)**:
- **Trend**: Weak upward slope (r = 0.916).
- **Data Points**:
- (0.0, 0.625), (0.1, 0.63), (0.2, 0.64), (0.3, 0.65), (0.4, 0.66).
- **Confidence Interval**: Wide, similar to the blue line.
---
### Key Observations
- **Positive Correlation**: All data series show a positive relationship between "Deep-Thinking Ratio" and "Accuracy (Pass@1)".
- **Correlation Strength**:
- Blue (ρ = 8.0e-01) has the highest correlation (r = 0.979).
- Cyan (ρ = 9.5e-01) has the lowest correlation (r = 0.916).
- **Statistical Significance**:
- P-values for all trend lines are above 0.9, suggesting weak statistical significance (if interpreted as p-values for correlation).
- **Confidence Intervals**:
- Red line (ρ = 8.5e-01) has the narrowest interval, indicating precise estimates.
- Blue and cyan lines have wider intervals, reflecting greater uncertainty.
---
### Interpretation
The graph demonstrates that higher "Deep-Thinking Ratio" values generally correspond to increased "Accuracy (Pass@1)", with the strongest relationship observed at ρ = 8.0e-01 (blue line). However, the statistical significance of these correlations is questionable, as p-values exceed 0.9, which typically indicates a lack of strong evidence against the null hypothesis. The narrow confidence interval for the red line (ρ = 8.5e-01) suggests that this series has the most reliable estimates, while the blue and cyan lines exhibit greater variability.
The data implies that optimizing "Deep-Thinking Ratio" could improve accuracy, but the weak statistical significance of the correlations warrants further investigation. The shaded regions highlight the trade-off between model complexity (depth fraction) and predictive reliability, with higher ρ values showing diminishing returns in accuracy.