## Diagram: Diagram of Equivalent Representations
### Overview
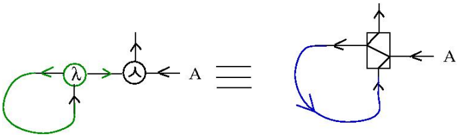
The image presents a diagram illustrating the equivalence between two different graphical representations. The diagram consists of two distinct arrangements of symbols and lines, connected by a triple horizontal line symbol, indicating equivalence. The left side features a green loop connected to a green circle containing the symbol "λ", which is connected to a black circle containing a "Y" symbol. The right side features a blue loop connected to a square containing two diagonal lines. Arrows indicate the direction of flow or connection.
### Components/Axes
* **Left Side:**
* Green Loop: A curved line forming a loop, colored green.
* Green Circle: A circle colored green, containing the symbol "λ".
* Black Circle: A circle colored black, containing the symbol "Y".
* Arrows: Indicate direction of flow or connection.
* "A": A label positioned to the right of the rightmost black circle.
* **Equivalence Symbol:**
* Triple Horizontal Lines: Three horizontal lines stacked on top of each other, indicating equivalence.
* **Right Side:**
* Blue Loop: A curved line forming a loop, colored blue.
* Square: A square containing two diagonal lines.
* Arrows: Indicate direction of flow or connection.
* "A": A label positioned to the right of the square.
### Detailed Analysis
* **Left Side:**
* A green loop starts from the bottom of the green circle containing "λ" and curves back to connect to the left side of the same circle.
* The green circle containing "λ" is connected to the black circle containing "Y" via a horizontal line.
* The black circle containing "Y" has an arrow pointing upwards and another arrow pointing to the left, connecting to the green circle.
* The label "A" is positioned to the right of the black circle.
* **Equivalence Symbol:**
* The triple horizontal lines are positioned between the left and right sides of the diagram, indicating equivalence.
* **Right Side:**
* A blue loop starts from the bottom of the square and curves back to connect to the left side of the square.
* The square contains two diagonal lines.
* The square has an arrow pointing upwards and another arrow pointing to the right.
* The label "A" is positioned to the right of the square.
### Key Observations
* The diagram illustrates the equivalence between two different graphical representations.
* The left side features a green loop connected to a green circle containing "λ", which is connected to a black circle containing "Y".
* The right side features a blue loop connected to a square containing two diagonal lines.
* Arrows indicate the direction of flow or connection.
### Interpretation
The diagram likely represents an equivalence in a mathematical or physical system. The symbols "λ" and "Y", along with the loops and arrows, suggest a flow or transformation process. The equivalence symbol indicates that the two different arrangements of symbols and lines represent the same underlying concept or operation. The labels "A" on both sides might represent a common input or output. The diagram could be used to simplify or transform a complex system into a more manageable form.