## Charts: Training Dynamics of Different Learning Strategies
### Overview
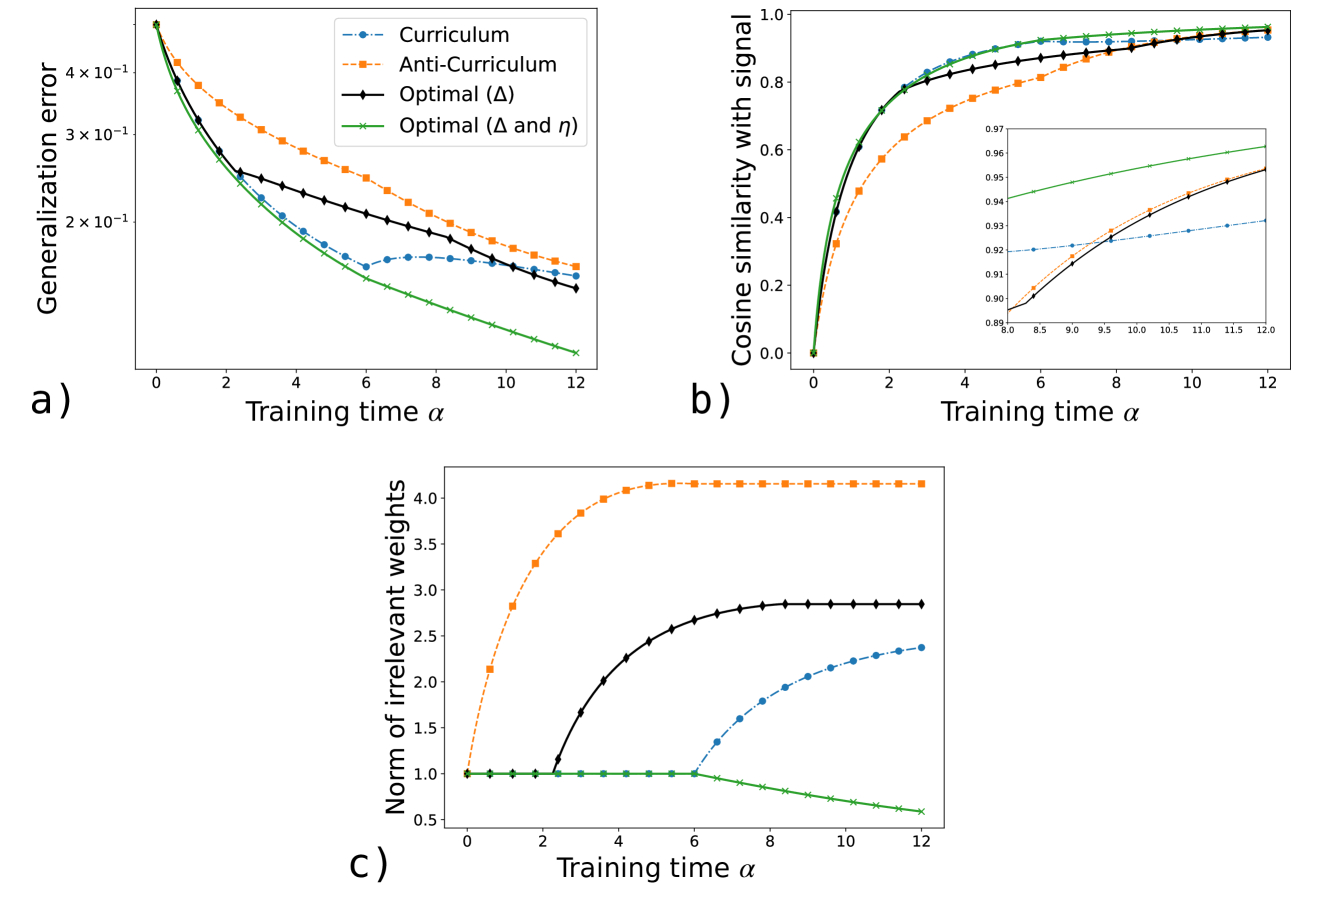
The image presents three separate charts (a, b, and c) illustrating the training dynamics of different learning strategies: Curriculum, Anti-Curriculum, Optimal (Δ), and Optimal (Δ and η). Each chart plots a different metric against the training time α.
### Components/Axes
**Chart a: Generalization Error**
* **X-axis:** Training time α (ranging from 0 to approximately 12).
* **Y-axis:** Generalization error (logarithmic scale, ranging from approximately 1x10^-1 to 1x10^-3).
* **Legend:**
* Curriculum (Blue, dashed)
* Anti-Curriculum (Orange, dashed-dotted)
* Optimal (Δ) (Black, solid)
* Optimal (Δ and η) (Green, solid)
**Chart b: Cosine Similarity with Signal**
* **X-axis:** Training time α (ranging from 0 to approximately 12).
* **Y-axis:** Cosine similarity with signal (ranging from 0 to 1).
* **Legend:**
* Curriculum (Blue, dashed)
* Anti-Curriculum (Orange, dashed-dotted)
* Optimal (Δ) (Black, solid)
* Optimal (Δ and η) (Green, solid)
* **Inset Chart:** A zoomed-in view of the cosine similarity for the Curriculum and Anti-Curriculum strategies, focusing on the range of training time α from 8 to 12.
**Chart c: Norm of Irrelevant Weights**
* **X-axis:** Training time α (ranging from 0 to approximately 12).
* **Y-axis:** Norm of irrelevant weights (ranging from 0.5 to 4.0).
* **Legend:**
* Curriculum (Blue, dashed)
* Anti-Curriculum (Orange, dashed-dotted)
* Optimal (Δ) (Black, solid)
* Optimal (Δ and η) (Green, solid)
### Detailed Analysis or Content Details
**Chart a: Generalization Error**
* **Curriculum (Blue):** Starts at approximately 0.35, decreases rapidly initially, then plateaus around 0.02 at α ≈ 8, and shows a slight increase towards α ≈ 12, ending at approximately 0.025.
* **Anti-Curriculum (Orange):** Starts at approximately 0.35, decreases rapidly initially, then plateaus around 0.03 at α ≈ 6, and remains relatively stable until α ≈ 12, ending at approximately 0.03.
* **Optimal (Δ) (Black):** Starts at approximately 0.35, decreases steadily and more rapidly than the other strategies, reaching approximately 0.01 at α ≈ 6, and continues to decrease slowly, ending at approximately 0.008 at α ≈ 12.
* **Optimal (Δ and η) (Green):** Starts at approximately 0.35, decreases rapidly initially, reaching approximately 0.01 at α ≈ 4, and continues to decrease slowly, ending at approximately 0.007 at α ≈ 12.
**Chart b: Cosine Similarity with Signal**
* **Curriculum (Blue):** Starts at approximately 0.2, increases rapidly to approximately 0.8 at α ≈ 4, then increases slowly, reaching approximately 0.9 at α ≈ 8, and remains relatively stable, ending at approximately 0.92 at α ≈ 12.
* **Anti-Curriculum (Orange):** Starts at approximately 0.9, decreases slowly to approximately 0.85 at α ≈ 4, then remains relatively stable, ending at approximately 0.88 at α ≈ 12.
* **Optimal (Δ) (Black):** Starts at approximately 0.2, increases rapidly to approximately 0.7 at α ≈ 4, then increases slowly, reaching approximately 0.9 at α ≈ 8, and remains relatively stable, ending at approximately 0.94 at α ≈ 12.
* **Optimal (Δ and η) (Green):** Starts at approximately 0.2, increases rapidly to approximately 0.8 at α ≈ 4, then increases slowly, reaching approximately 0.95 at α ≈ 6, and remains relatively stable, ending at approximately 0.97 at α ≈ 12.
* **Inset Chart:** Shows the Curriculum (Blue) and Anti-Curriculum (Orange) lines in more detail between α = 8 and α = 12. The Curriculum line is slightly lower than the Anti-Curriculum line.
**Chart c: Norm of Irrelevant Weights**
* **Curriculum (Blue):** Starts at approximately 1.0, increases slowly to approximately 1.5 at α ≈ 4, then increases more slowly, ending at approximately 1.8 at α ≈ 12.
* **Anti-Curriculum (Orange):** Starts at approximately 1.0, increases rapidly to approximately 4.0 at α ≈ 4, then remains relatively stable, ending at approximately 4.0 at α ≈ 12.
* **Optimal (Δ) (Black):** Starts at approximately 1.0, increases slowly to approximately 1.5 at α ≈ 4, then increases more slowly, ending at approximately 2.0 at α ≈ 12.
* **Optimal (Δ and η) (Green):** Starts at approximately 1.0, increases slowly to approximately 1.5 at α ≈ 4, then increases more slowly, ending at approximately 2.2 at α ≈ 12.
### Key Observations
* The "Optimal (Δ and η)" strategy consistently achieves the lowest generalization error (Chart a) and the highest cosine similarity with the signal (Chart b).
* The "Anti-Curriculum" strategy exhibits the highest norm of irrelevant weights (Chart c), indicating a potential for overfitting or learning irrelevant features.
* The "Curriculum" strategy shows a moderate performance across all three metrics.
* The inset chart in Chart b highlights the subtle difference in cosine similarity between the Curriculum and Anti-Curriculum strategies at later training stages.
### Interpretation
These charts demonstrate the impact of different learning strategies on the training dynamics of a model. The "Optimal (Δ and η)" strategy appears to be the most effective, achieving the best balance between generalization performance, signal alignment, and irrelevant weight control. The "Anti-Curriculum" strategy, while initially performing well, suffers from a high norm of irrelevant weights, suggesting that it may be learning spurious correlations or overfitting to the training data. The "Curriculum" strategy provides a reasonable compromise, but does not achieve the same level of performance as the optimal strategies.
The relationship between the charts is evident: lower generalization error (Chart a) is correlated with higher cosine similarity with the signal (Chart b) and lower norm of irrelevant weights (Chart c). This suggests that a successful learning strategy should prioritize learning relevant features while minimizing the influence of irrelevant ones. The inset chart in Chart b provides a more granular view of the differences between the Curriculum and Anti-Curriculum strategies, highlighting the importance of carefully controlling the order and content of training examples. The logarithmic scale on the y-axis of Chart a emphasizes the significant improvements achieved by the optimal strategies in reducing generalization error.