TECHNICAL ASSET FINGERPRINT
007c598a0506e02da6bd479e
Click to view fullscreen
Press ESC or click to close
FOUND IN PAPERS
EXPERT: healer-alpha-free VERSION 1
RUNTIME: free/openrouter/healer-alpha
INTEL_VERIFIED
## Line Charts: Training Dynamics of Curriculum Learning Strategies
### Overview
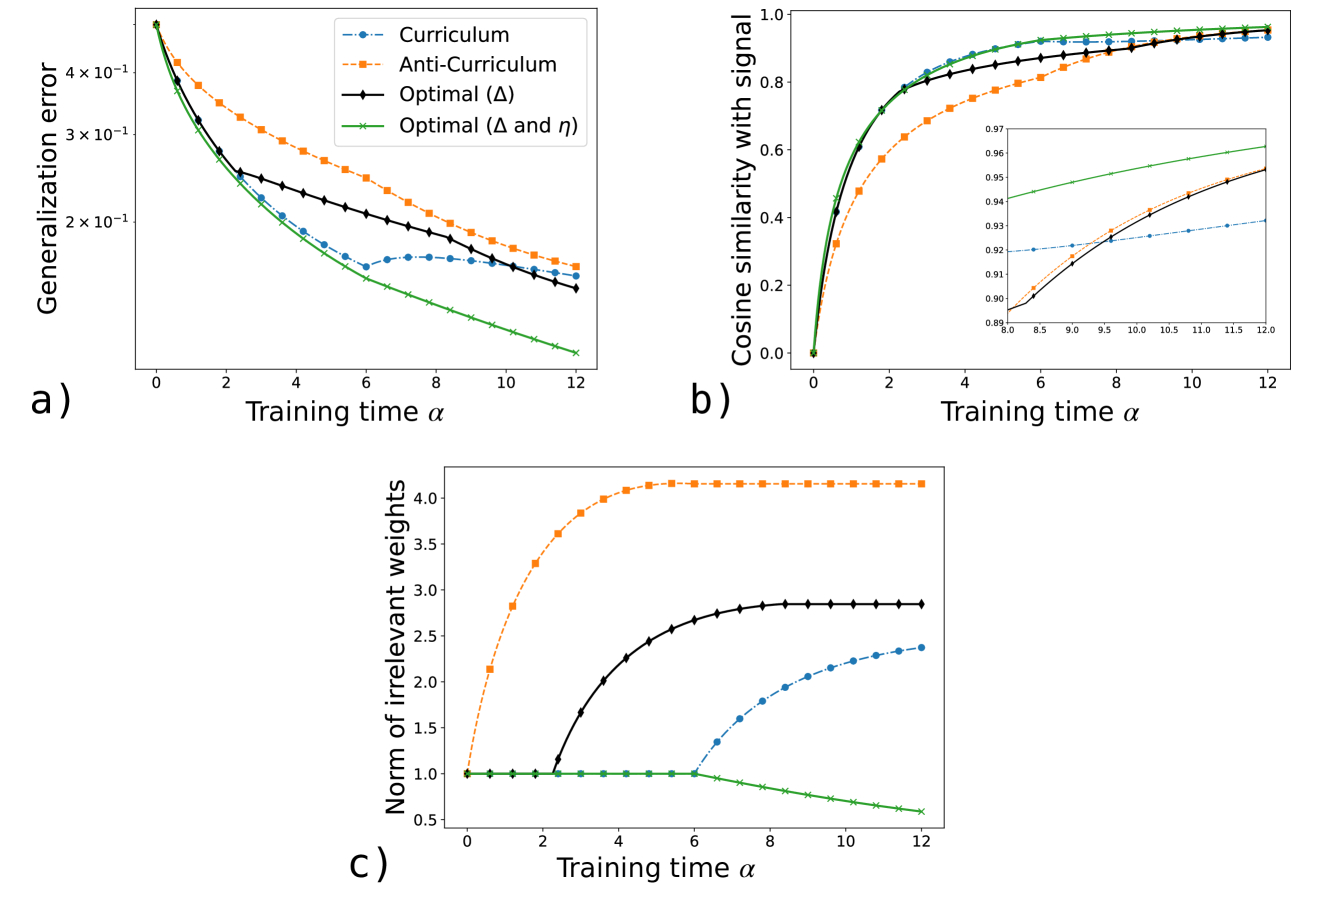
The image contains three line charts labeled a), b), and c), arranged with a) and b) in the top row and c) centered below them. The charts collectively visualize the training dynamics of four different learning strategies over a common x-axis, "Training time α". The strategies are distinguished by color and marker style, as defined in a shared legend. The plots track three different metrics: generalization error, cosine similarity with a signal, and the norm of irrelevant weights.
### Components/Axes
* **Common X-Axis (All Plots):** "Training time α". The scale is linear, ranging from 0 to 12 with major tick marks at intervals of 2 (0, 2, 4, 6, 8, 10, 12).
* **Legend (Present in plot a, top-right corner):**
* **Curriculum:** Blue dashed line with circular markers (`--o`).
* **Anti-Curriculum:** Orange dashed line with square markers (`--s`).
* **Optimal (Δ):** Black solid line with diamond markers (`-d`).
* **Optimal (Δ and η):** Green solid line with 'x' markers (`-x`).
* **Plot a) Y-Axis:** "Generalization error". The scale is logarithmic, with labeled ticks at `2 x 10^-1`, `3 x 10^-1`, and `4 x 10^-1`.
* **Plot b) Y-Axis:** "Cosine similarity with signal". The scale is linear, ranging from 0.0 to 1.0 with ticks at 0.2 intervals.
* **Inset Plot (within plot b, bottom-right):** A zoomed-in view of the later training period (α from 8.0 to 12.0). Its y-axis ranges from 0.89 to 0.97.
* **Plot c) Y-Axis:** "Norm of irrelevant weights". The scale is linear, ranging from 0.5 to 4.0 with ticks at 0.5 intervals.
### Detailed Analysis
**Plot a) Generalization Error vs. Training Time**
* **Trend Verification:** All four lines show a downward trend, indicating decreasing error over training time. The rate of decrease varies significantly.
* **Data Series Analysis:**
* **Optimal (Δ and η) [Green, 'x']:** Shows the steepest and most consistent decline. Starts near 4.5 x 10^-1 at α=0 and ends at the lowest point, approximately 1.0 x 10^-1 at α=12.
* **Optimal (Δ) [Black, diamond]:** Follows a similar but slightly less steep path than the green line. Ends at approximately 1.5 x 10^-1 at α=12.
* **Curriculum [Blue, circle]:** Declines steadily until about α=6, after which the rate of improvement slows considerably. Ends at approximately 1.7 x 10^-1 at α=12.
* **Anti-Curriculum [Orange, square]:** Shows the slowest rate of decrease. Remains the highest error curve throughout. Ends at approximately 1.8 x 10^-1 at α=12.
**Plot b) Cosine Similarity with Signal vs. Training Time**
* **Trend Verification:** All lines show an upward trend, indicating increasing alignment with the target signal over time. They rise sharply initially and then plateau.
* **Data Series Analysis:**
* **Optimal (Δ and η) [Green, 'x']:** Rises the fastest and achieves the highest similarity, approaching ~0.97 by α=12.
* **Optimal (Δ) [Black, diamond]:** Very closely follows the green line, ending just slightly below it at α=12.
* **Curriculum [Blue, circle]:** Rises more slowly than the optimal methods. The inset shows it has the lowest similarity in the late stage, ending at ~0.93 at α=12.
* **Anti-Curriculum [Orange, square]:** Initially lags significantly behind the others but shows a steady increase. The inset reveals it surpasses the Curriculum (blue) line around α=9.5, ending at ~0.95 at α=12.
* **Inset Detail:** The inset (x: 8.0-12.0, y: 0.89-0.97) clearly shows the late-stage ordering: Green (highest) > Black > Orange > Blue (lowest).
**Plot c) Norm of Irrelevant Weights vs. Training Time**
* **Trend Verification:** The trends diverge dramatically. The orange and black lines increase, the blue line increases after a delay, and the green line decreases.
* **Data Series Analysis:**
* **Anti-Curriculum [Orange, square]:** Increases rapidly from α=0, plateaus around α=5, and remains constant at the highest value of ~4.2.
* **Optimal (Δ) [Black, diamond]:** Begins increasing later (around α=2), rises steadily, and plateaus around α=8 at a value of ~2.8.
* **Curriculum [Blue, circle]:** Remains flat at ~1.0 until α=6, then begins a steady increase, reaching ~2.4 at α=12.
* **Optimal (Δ and η) [Green, 'x']:** The only strategy that reduces this norm. It starts at ~1.0 and decreases steadily throughout training, ending at ~0.6 at α=12.
### Key Observations
1. **Performance Hierarchy:** The "Optimal (Δ and η)" strategy (green) consistently performs best across all metrics: lowest generalization error, highest signal similarity, and lowest norm of irrelevant weights.
2. **Anti-Curriculum Drawback:** The "Anti-Curriculum" strategy (orange) results in the highest generalization error and causes the norm of irrelevant weights to grow the largest and fastest, suggesting it may be fitting noise.
3. **Delayed Effects:** The "Curriculum" strategy (blue) shows a delayed increase in the norm of irrelevant weights (starting at α=6), which coincides with the slowing of its improvement in generalization error (plot a).
4. **Similarity vs. Generalization:** While all methods achieve high cosine similarity (>0.9) by the end, their generalization errors differ significantly. This indicates that high similarity with the signal alone does not guarantee optimal generalization; controlling irrelevant weights (as the green line does) appears crucial.
### Interpretation
The data demonstrates the comparative effectiveness of different curriculum learning schedules. The "Optimal" strategies, which presumably use a theoretically derived schedule, outperform the simpler Curriculum and Anti-Curriculum approaches.
The key insight is the relationship between the three metrics. Plot c) reveals the mechanism behind the performance differences in plots a) and b). The "Optimal (Δ and η)" method is unique in its ability to *suppress* the norm of irrelevant weights while simultaneously increasing similarity with the relevant signal. This selective pressure likely explains its superior generalization. In contrast, the Anti-Curriculum method aggressively increases the norm of irrelevant weights, which correlates with its poor generalization despite achieving reasonable signal similarity. The standard Curriculum method shows a middle ground, where a late-stage increase in irrelevant weight norm may be limiting its final performance.
Therefore, the charts suggest that an effective training strategy must not only align with the target signal but also actively discourage the model from relying on irrelevant features. The "Optimal (Δ and η)" schedule appears to successfully balance these two objectives.
DECODING INTELLIGENCE...