## Histogram Comparison: Original vs. Quantized GPT2 Weights
### Overview
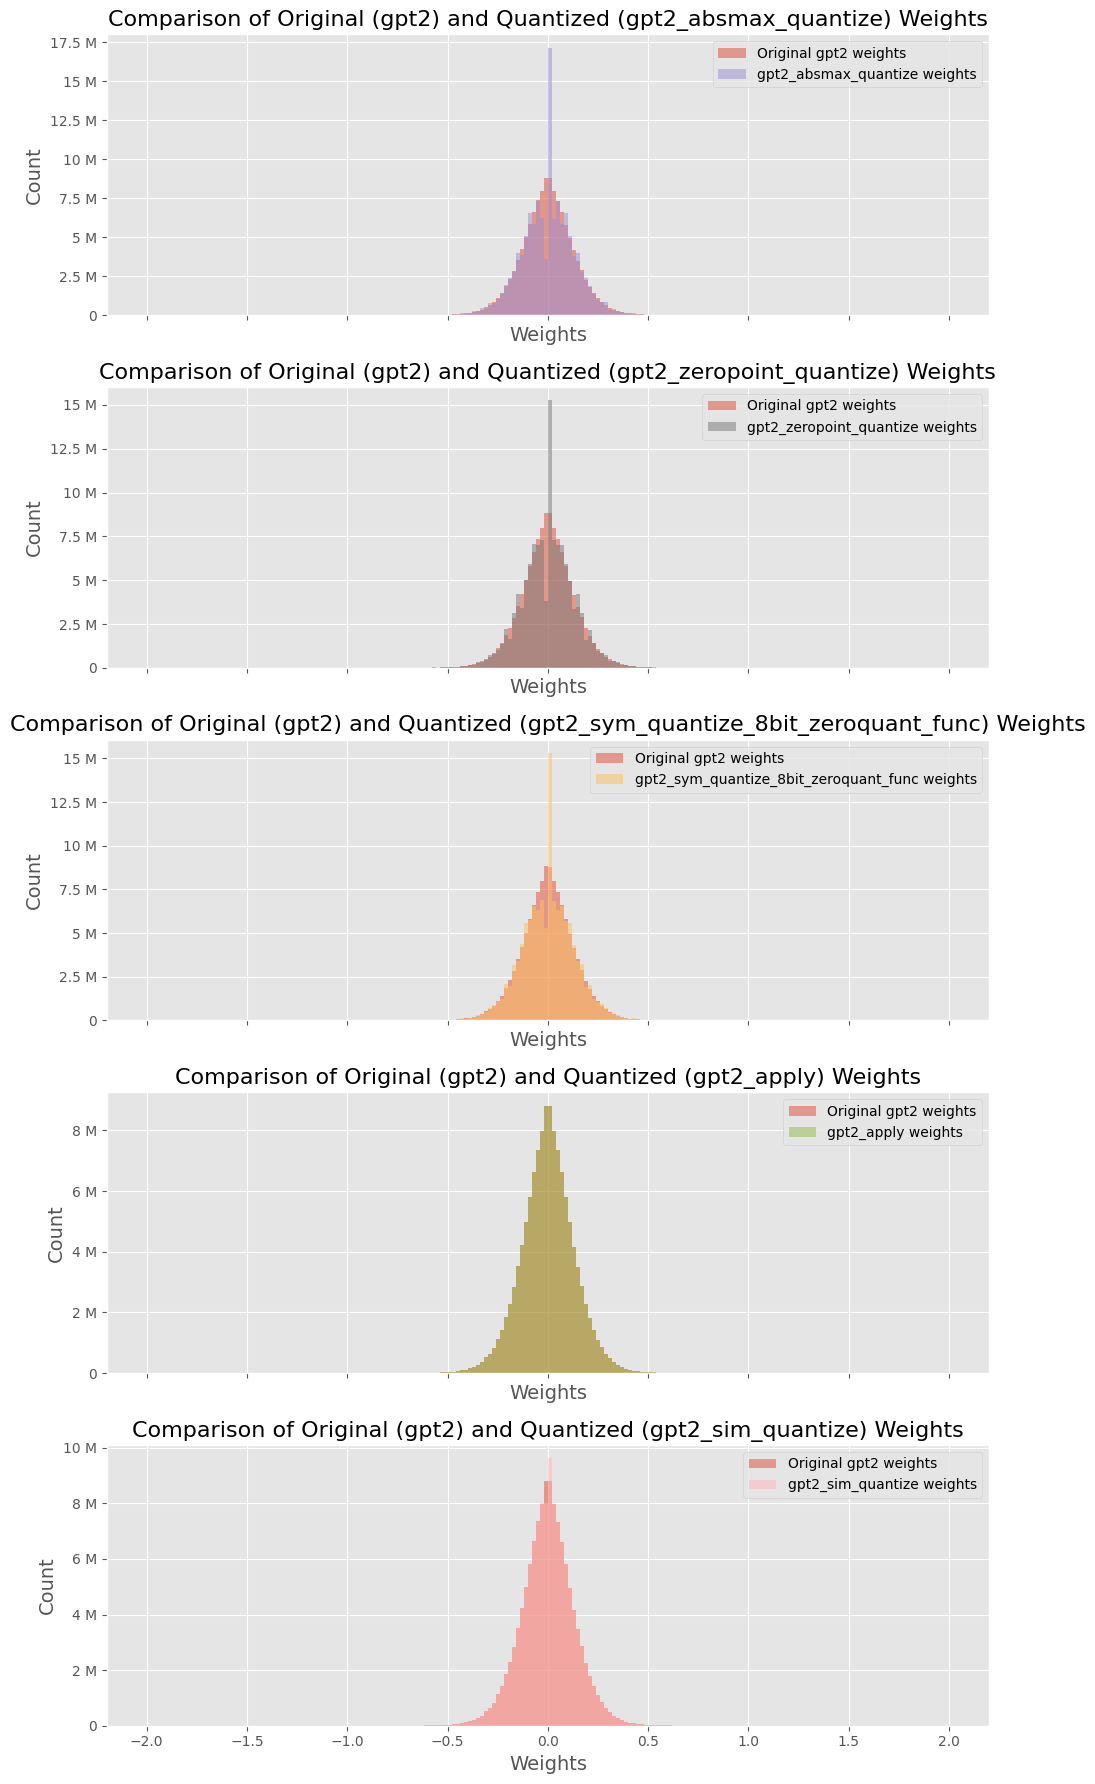
The image presents a series of five histograms, each comparing the weight distribution of the original GPT2 model against a quantized version. Each histogram represents a different quantization method. The x-axis represents the weight values, and the y-axis represents the count of weights.
### Components/Axes
Each of the five subplots shares the following structure:
* **Title:** "Comparison of Original (gpt2) and Quantized (gpt2_[quantization method]) Weights"
* **X-axis:** Labeled "Weights", with a range from approximately -2.0 to 2.0, incrementing by 0.5.
* **Y-axis:** Labeled "Count", with a range varying per subplot, but generally spanning from 0 to a maximum value between 8M and 17.5M, incrementing by 2.5M or 2M.
* **Legend:** Located in the top-right corner of each subplot, indicating the colors for "Original gpt2 weights" and the specific quantized weights.
The quantization methods compared are:
1. `gpt2_absmax_quantize`
2. `gpt2_zeropoint_quantize`
3. `gpt2_sym_quantize_8bit_zeroquant_func`
4. `gpt2_apply`
5. `gpt2_sim_quantize`
### Detailed Analysis
**1. gpt2_absmax_quantize:**
* **Original gpt2 weights (light red):** The distribution is centered around 0, with a bell-shaped curve.
* **gpt2_absmax_quantize weights (light purple):** The distribution is much narrower and taller than the original, also centered around 0. The peak count is approximately 17.5M.
* **Trend:** The quantized weights are more concentrated around zero compared to the original weights.
**2. gpt2_zeropoint_quantize:**
* **Original gpt2 weights (light red):** Similar bell-shaped distribution centered around 0.
* **gpt2_zeropoint_quantize weights (gray):** A very narrow spike at 0, with a peak count of approximately 15M.
* **Trend:** The quantized weights are highly concentrated at zero.
**3. gpt2_sym_quantize_8bit_zeroquant_func:**
* **Original gpt2 weights (light red):** Similar bell-shaped distribution centered around 0.
* **gpt2_sym_quantize_8bit_zeroquant_func weights (light orange):** A narrower bell-shaped distribution centered around 0, but wider than the `gpt2_zeropoint_quantize` distribution. The peak count is approximately 12.5M.
* **Trend:** The quantized weights are more concentrated around zero compared to the original weights.
**4. gpt2_apply:**
* **Original gpt2 weights (light red):** Similar bell-shaped distribution centered around 0.
* **gpt2_apply weights (light green):** A narrower bell-shaped distribution centered around 0. The peak count is approximately 8M.
* **Trend:** The quantized weights are more concentrated around zero compared to the original weights.
**5. gpt2_sim_quantize:**
* **Original gpt2 weights (light red):** Similar bell-shaped distribution centered around 0. The peak count is approximately 10M.
* **gpt2_sim_quantize weights (no color):** Overlaps the original weights.
* **Trend:** The quantized weights have a similar distribution to the original weights.
### Key Observations
* All original GPT2 weight distributions are centered around 0 and have a similar bell-shaped curve.
* The quantized weight distributions vary significantly depending on the quantization method used.
* Some quantization methods (e.g., `gpt2_zeropoint_quantize`) result in a highly concentrated distribution at zero, while others (e.g., `gpt2_sim_quantize`) maintain a distribution similar to the original weights.
* The `gpt2_absmax_quantize`, `gpt2_sym_quantize_8bit_zeroquant_func`, and `gpt2_apply` methods result in distributions that are narrower than the original but still bell-shaped.
### Interpretation
The histograms illustrate the impact of different quantization methods on the weight distribution of the GPT2 model. Quantization aims to reduce the memory footprint and computational cost of the model, often by representing weights with fewer bits. However, this can alter the weight distribution, potentially affecting the model's performance.
The `gpt2_zeropoint_quantize` method appears to aggressively quantize the weights, pushing most values to zero. This could lead to a significant loss of information and potentially degrade the model's accuracy. In contrast, the `gpt2_sim_quantize` method seems to preserve the original weight distribution more closely, which might result in better performance after quantization. The other methods represent intermediate levels of quantization, with varying degrees of concentration around zero.
The choice of quantization method depends on the trade-off between model size, computational efficiency, and acceptable performance degradation. These visualizations provide insights into how different methods affect the weight distribution, which is a crucial factor in this trade-off.