## Histograms: Comparison of Original (gpt2) and Quantized Weights
### Overview
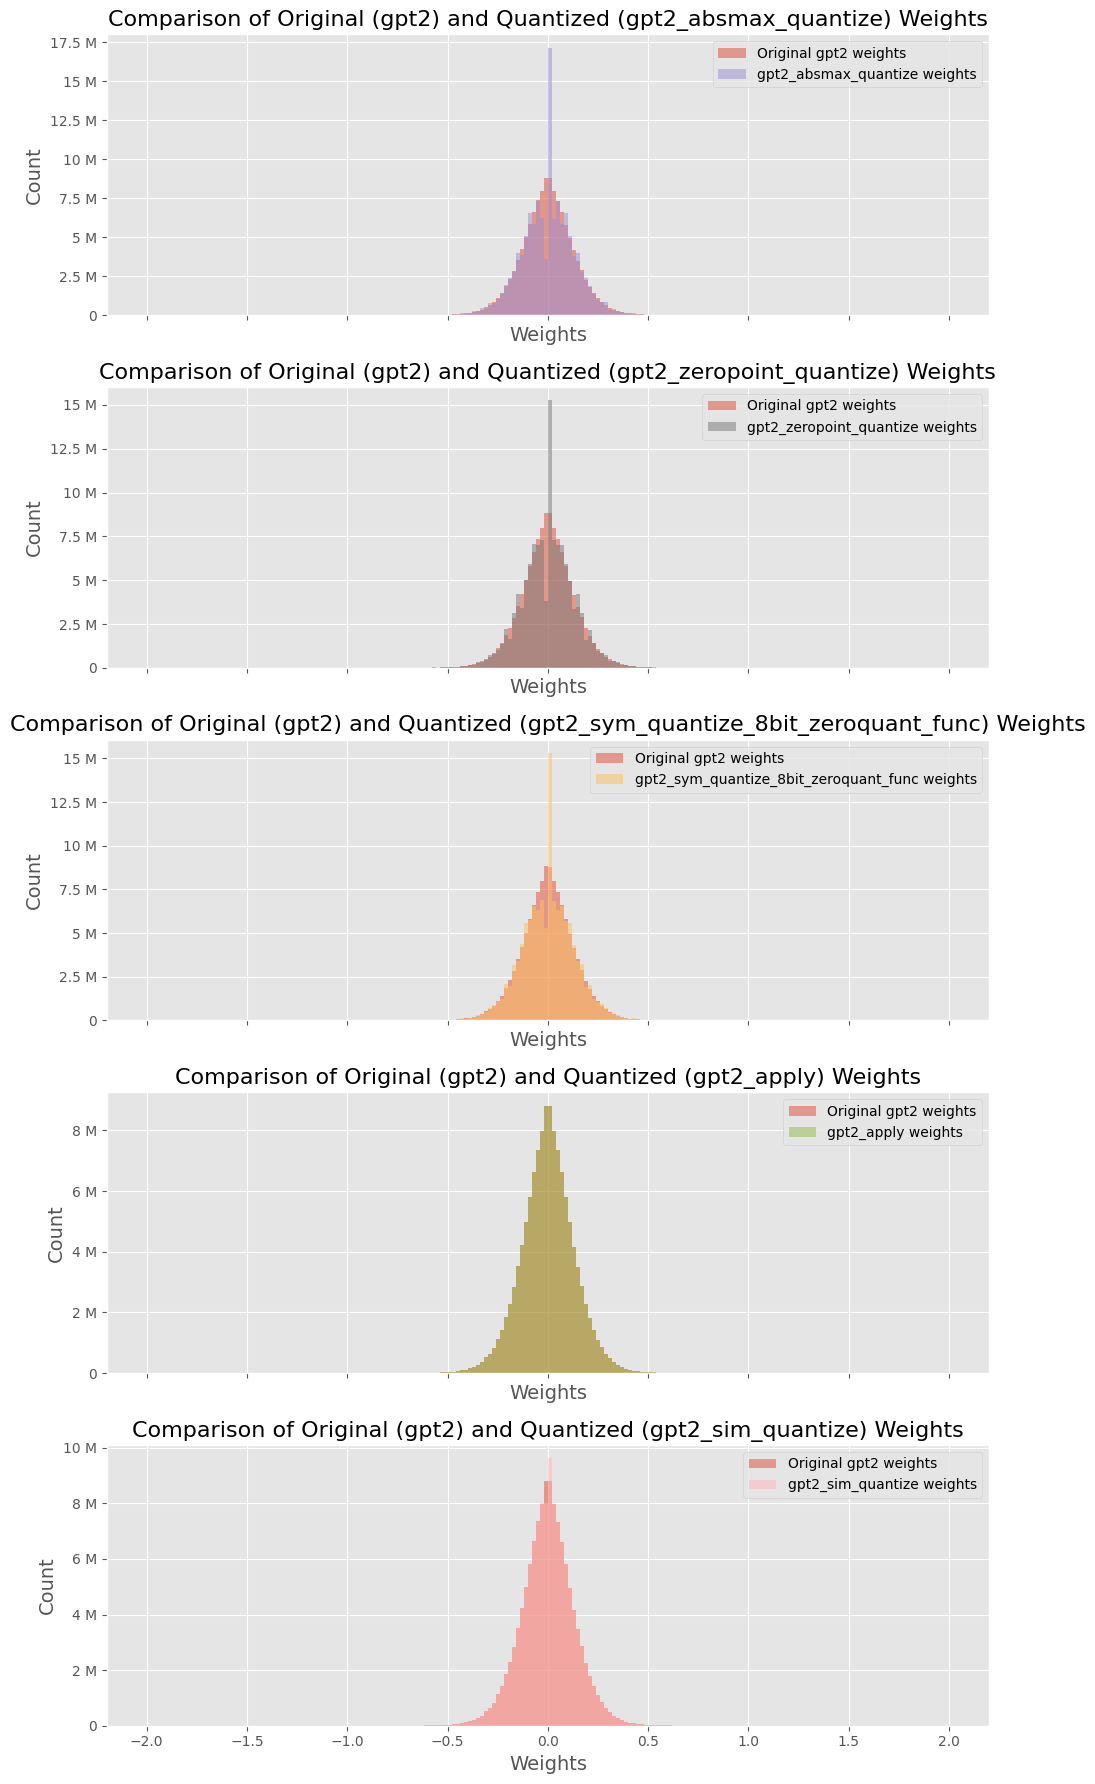
The image presents five histograms, each comparing the distribution of weights for the original GPT-2 model against a quantized version of the model. Each histogram visualizes the 'Count' of weights against their 'Weights' value. The quantization methods used are: `absmax_quantize`, `zeropoint_quantize`, `gpt2_sym_quantize_8bit_zeroquant_func`, `apply`, and `sim_quantize`.
### Components/Axes
* **X-axis:** Labeled "Weights". Scale ranges from approximately -2.0 to 2.0, though the exact range varies slightly between histograms.
* **Y-axis:** Labeled "Count". Scale ranges from 0 to approximately 17.5M (varying between histograms).
* **Title:** Each histogram has a title indicating the comparison being made.
* **Legend:** Each histogram includes a legend with two entries:
* "Original gpt2 weights" (represented by a light orange color)
* The name of the quantization method applied (represented by a darker red color).
* **Histograms:** Each chart is a histogram showing the distribution of weights.
### Detailed Analysis or Content Details
**1. Comparison: Original vs. absmax_quantize**
* The original weights distribution (orange) appears roughly symmetrical around 0, with a peak around 0.
* The `gpt2_absmax_quantize` weights (red) show a bimodal distribution, with peaks around -0.5 and 0.5.
* Approximate data points (visually estimated):
* Original: Peak count ~ 12M at weight ~ 0.
* Quantized: Peaks ~ 7M at weights ~ -0.5 and 0.5.
**2. Comparison: Original vs. zeropoint_quantize**
* The original weights distribution (orange) is similar to the first histogram, symmetrical around 0 with a peak near 0.
* The `gpt2_zeropoint_quantize` weights (red) also show a bimodal distribution, with peaks around -0.5 and 0.5.
* Approximate data points:
* Original: Peak count ~ 12.5M at weight ~ 0.
* Quantized: Peaks ~ 7.5M at weights ~ -0.5 and 0.5.
**3. Comparison: Original vs. gpt2_sym_quantize_8bit_zeroquant_func**
* The original weights distribution (orange) is again symmetrical around 0, peaking near 0.
* The `gpt2_sym_quantize_8bit_zeroquant_func` weights (red) exhibit a bimodal distribution, with peaks around -0.5 and 0.5.
* Approximate data points:
* Original: Peak count ~ 15M at weight ~ 0.
* Quantized: Peaks ~ 7.5M at weights ~ -0.5 and 0.5.
**4. Comparison: Original vs. apply**
* The original weights distribution (orange) is centered around 0.
* The `gpt2_apply` weights (red) show a distribution that is more spread out, with a peak around 0, but also significant counts at higher and lower weight values (up to approximately -1.5 and 1.5).
* Approximate data points:
* Original: Peak count ~ 6M at weight ~ 0.
* Quantized: Peak count ~ 4M at weight ~ 0, with significant counts extending to ~ +/- 1.5.
**5. Comparison: Original vs. sim_quantize**
* The original weights distribution (orange) is symmetrical around 0, peaking near 0.
* The `gpt2_sim_quantize` weights (red) show a bimodal distribution, with peaks around -0.5 and 0.5.
* Approximate data points:
* Original: Peak count ~ 8M at weight ~ 0.
* Quantized: Peaks ~ 6M at weights ~ -0.5 and 0.5.
### Key Observations
* Most quantization methods (`absmax_quantize`, `zeropoint_quantize`, `gpt2_sym_quantize_8bit_zeroquant_func`, `sim_quantize`) result in a bimodal distribution of weights, centered around -0.5 and 0.5. This suggests a clustering of weights around these quantized values.
* The `apply` quantization method produces a more spread-out distribution, with weights extending further from 0.
* The original weights consistently show a more symmetrical distribution centered around 0.
* The peak count for the original weights is generally higher than the peak counts for the quantized weights, indicating a loss of information or a change in the distribution during quantization.
### Interpretation
These histograms demonstrate the impact of different quantization methods on the distribution of weights in a GPT-2 model. Quantization aims to reduce the memory footprint and computational cost of the model by representing weights with fewer bits. However, this process inevitably introduces some level of approximation and information loss.
The bimodal distributions observed in most quantized versions suggest that the weights are being mapped to a limited set of discrete values. The clustering around -0.5 and 0.5 likely reflects the quantization levels used by these methods. The `apply` method's broader distribution might indicate a different quantization strategy that allows for a wider range of values, potentially at the cost of greater approximation error.
The shift from a symmetrical distribution in the original weights to bimodal distributions in the quantized weights indicates a change in the model's representation. This change could affect the model's performance, and the extent of the impact would depend on the specific quantization method and the task being performed. The lower peak counts in the quantized distributions suggest a reduction in the diversity of weights, which could potentially lead to a decrease in model capacity.