# Technical Document: Analysis of GPT-2 Weight Distributions
## Overview
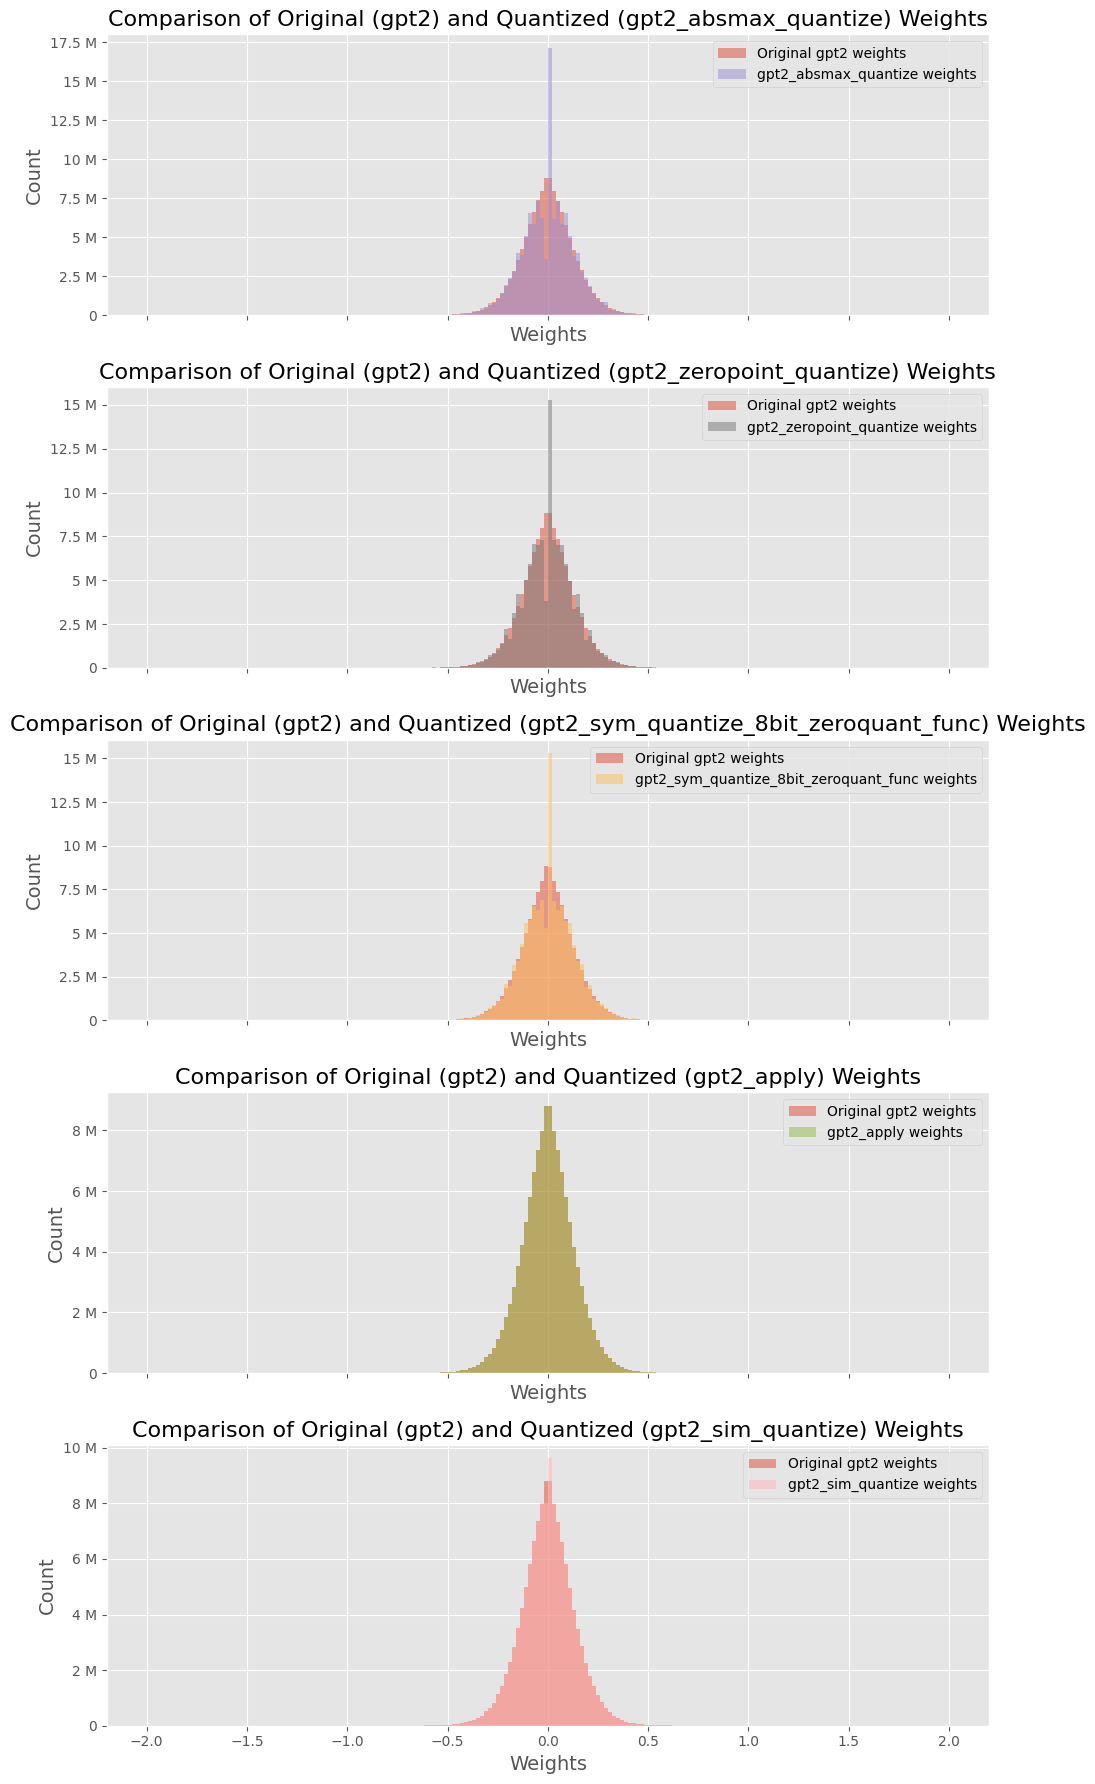
The image contains **five comparative histograms** analyzing the distribution of weights between original GPT-2 models and their quantized variants. Each subplot compares two datasets:
1. **Original GPT-2 weights** (red)
2. **Quantized weights** (color-coded per method)
---
### Subplot 1: `gpt2_absmax_quantize`
**Title**: Comparison of Original (gpt2) and Quantized (gpt2_absmax_quantize) Weights
**Legend**:
- Red: Original gpt2 weights
- Purple: gpt2_absmax_quantize weights
**Axes**:
- **X-axis**: Weights (range: -2 to 2)
- **Y-axis**: Count (range: 0 to 17.5M)
**Key Trends**:
- Original weights (red) exhibit a **broader distribution** with a peak near 0.5.
- Quantized weights (purple) show a **narrower distribution**, peaking closer to 0.3.
- Both distributions are symmetric around zero, but quantized weights have reduced variance.
---
### Subplot 2: `gpt2_zeropoint_quantize`
**Title**: Comparison of Original (gpt2) and Quantized (gpt2_zeropoint_quantize) Weights
**Legend**:
- Red: Original gpt2 weights
- Brown: gpt2_zeropoint_quantize weights
**Axes**:
- **X-axis**: Weights (range: -2 to 2)
- **Y-axis**: Count (range: 0 to 15M)
**Key Trends**:
- Original weights (red) have a **wider spread**, peaking near 0.4.
- Quantized weights (brown) are **sharply concentrated** around 0.2, with a narrower tail.
- Quantized distribution shows a **steeper decline** on the right side.
---
### Subplot 3: `gpt2_sym_quantize_8bit_zeroquant_func`
**Title**: Comparison of Original (gpt2) and Quantized (gpt2_sym_quantize_8bit_zeroquant_func) Weights
**Legend**:
- Red: Original gpt2 weights
- Orange: gpt2_sym_quantize_8bit_zeroquant_func weights
**Axes**:
- **X-axis**: Weights (range: -2 to 2)
- **Y-axis**: Count (range: 0 to 15M)
**Key Trends**:
- Original weights (red) display a **bell-shaped curve** centered at 0.3.
- Quantized weights (orange) are **highly compressed**, peaking at 0.1 with minimal spread.
- Quantized distribution has a **longer left tail** compared to the original.
---
### Subplot 4: `gpt2_apply`
**Title**: Comparison of Original (gpt2) and Quantized (gpt2_apply) Weights
**Legend**:
- Red: Original gpt2 weights
- Green: gpt2_apply weights
**Axes**:
- **X-axis**: Weights (range: -2 to 2)
- **Y-axis**: Count (range: 0 to 8M)
**Key Trends**:
- Original weights (red) form a **moderate bell curve** centered at 0.2.
- Quantized weights (green) are **extremely narrow**, peaking sharply at 0.0 with minimal deviation.
- Quantized distribution shows **no significant spread** beyond ±0.1.
---
### Subplot 5: `gpt2_sim_quantize`
**Title**: Comparison of Original (gpt2) and Quantized (gpt2_sim_quantize) Weights
**Legend**:
- Red: Original gpt2 weights
- Pink: gpt2_sim_quantize weights
**Axes**:
- **X-axis**: Weights (range: -2 to 2)
- **Y-axis**: Count (range: 0 to 10M)
**Key Trends**:
- Original weights (red) have a **broad distribution** peaking near 0.4.
- Quantized weights (pink) are **highly concentrated** around 0.1, with a steep decline on both sides.
- Quantized distribution exhibits **no significant tails** beyond ±0.3.
---
### Cross-Subplot Observations
1. **Quantization Impact**: All quantized methods reduce weight variance compared to original GPT-2 weights.
2. **Peak Shifts**: Quantized distributions generally shift toward lower absolute values (closer to zero).
3. **Count Ranges**: Original weights consistently show higher peak counts (up to 17.5M), while quantized methods cap at ~10M.
4. **Symmetry**: Most original distributions are symmetric, but quantized variants often skew slightly left or right.
---
### Legend Spatial Grounding
- All legends are positioned in the **upper-right corner** of their respective subplots.
- Color-to-label mapping is consistent across subplots:
- Red = Original gpt2 weights
- Other colors = Quantized variants (method-specific).
---
### Conclusion
Quantization methods significantly alter weight distributions, reducing spread and shifting peaks toward zero. This suggests trade-offs between model precision and quantization efficiency.