\n
## Bar Chart: F1 Score and BLEU-1 vs. k Values
### Overview
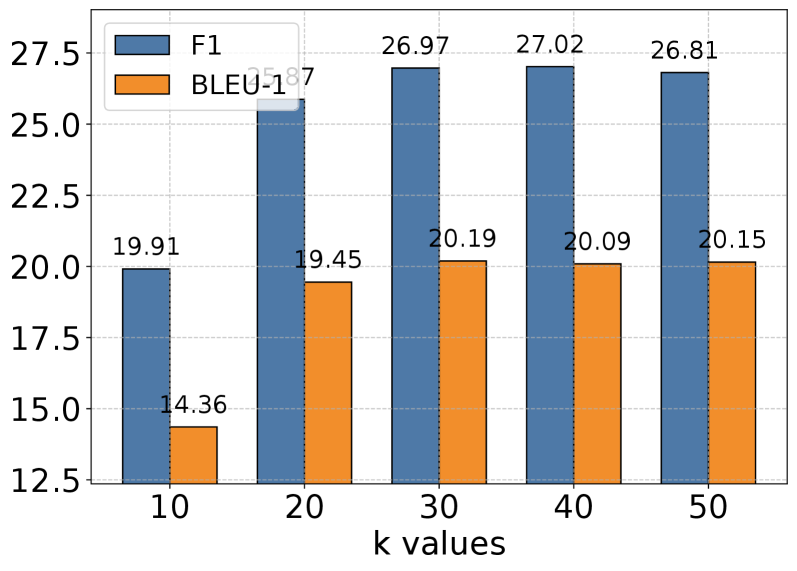
This bar chart compares the F1 score and BLEU-1 score for different 'k' values. The chart displays these metrics as bar heights for k values of 10, 20, 30, 40, and 50. The F1 score is consistently higher than the BLEU-1 score across all k values.
### Components/Axes
* **X-axis:** "k values" with markers at 10, 20, 30, 40, and 50.
* **Y-axis:** Scale ranging from 12.5 to 27.5, representing the score values.
* **Legend:** Located in the top-left corner.
* Blue bars: "F1"
* Orange bars: "BLEU-1"
### Detailed Analysis
The chart consists of paired bars for each k value, representing the F1 and BLEU-1 scores.
* **k = 10:**
* F1: Approximately 19.91
* BLEU-1: Approximately 14.36
* **k = 20:**
* F1: Approximately 25.48
* BLEU-1: Approximately 19.45
* **k = 30:**
* F1: Approximately 26.97
* BLEU-1: Approximately 20.19
* **k = 40:**
* F1: Approximately 27.02
* BLEU-1: Approximately 20.09
* **k = 50:**
* F1: Approximately 26.81
* BLEU-1: Approximately 20.15
The F1 score generally increases from k=10 to k=40, then slightly decreases at k=50. The BLEU-1 score shows a similar, but less pronounced, increasing trend.
### Key Observations
* The F1 score consistently outperforms the BLEU-1 score for all k values.
* The F1 score peaks at k=40, then experiences a minor decline at k=50.
* The BLEU-1 score shows a relatively stable increase from k=10 to k=50.
* The difference between the F1 and BLEU-1 scores is most significant at k=10 and gradually decreases as k increases.
### Interpretation
The data suggests that increasing the 'k' value generally improves both the F1 score and BLEU-1 score, up to a certain point. The 'k' value likely represents a parameter related to the number of candidates or options considered in a model or algorithm. The F1 score, which measures precision and recall, is a more sensitive metric than BLEU-1 in this context, showing a more pronounced response to changes in 'k'. The slight decrease in F1 score at k=50 could indicate diminishing returns or the onset of overfitting. The consistent gap between the F1 and BLEU-1 scores suggests that the model is better at capturing overall relevance (F1) than at precisely matching reference outputs (BLEU-1). The chart demonstrates a trade-off between model complexity (represented by 'k') and performance, with an optimal 'k' value around 40 in this case.