## Grouped Bar Chart: Performance Metrics by k Values
### Overview
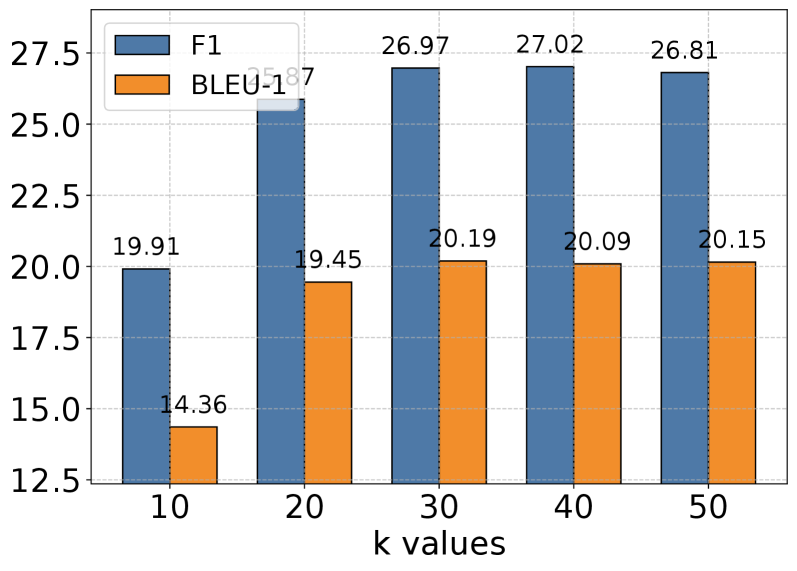
The image displays a grouped bar chart comparing two performance metrics, F1 and BLEU-1, across five different "k values" (10, 20, 30, 40, 50). The chart uses a blue and orange color scheme to differentiate the two metrics.
### Components/Axes
* **Chart Type:** Grouped Bar Chart.
* **X-Axis:** Labeled "k values". It has five categorical tick marks: 10, 20, 30, 40, and 50.
* **Y-Axis:** Numerical scale ranging from 12.5 to 27.5, with major gridlines at intervals of 2.5 (12.5, 15.0, 17.5, 20.0, 22.5, 25.0, 27.5). The axis title is not explicitly shown, but the values represent the score for the metrics.
* **Legend:** Located in the top-left corner of the plot area.
* A blue square corresponds to the label "F1".
* An orange square corresponds to the label "BLEU-1".
* **Data Labels:** Each bar has its exact numerical value displayed directly above it.
### Detailed Analysis
The chart presents paired bars for each k value. The left bar in each pair is blue (F1), and the right bar is orange (BLEU-1).
**Data Series: F1 (Blue Bars)**
* **Trend:** The F1 score increases sharply from k=10 to k=20, continues to increase to a peak at k=40, and then shows a very slight decrease at k=50.
* **Data Points:**
* k=10: 19.91
* k=20: 25.87
* k=30: 26.97
* k=40: 27.02
* k=50: 26.81
**Data Series: BLEU-1 (Orange Bars)**
* **Trend:** The BLEU-1 score increases from k=10 to k=30, then plateaus with very minor fluctuations for k=40 and k=50.
* **Data Points:**
* k=10: 14.36
* k=20: 19.45
* k=30: 20.19
* k=40: 20.09
* k=50: 20.15
### Key Observations
1. **Consistent Performance Gap:** The F1 score is consistently higher than the BLEU-1 score for every k value. The gap is smallest at k=10 (5.55 points) and largest at k=20 (6.42 points).
2. **Peak Performance:** Both metrics achieve their highest values at k=40 (F1: 27.02) and k=30 (BLEU-1: 20.19). The performance for both metrics is very similar between k=30, 40, and 50, suggesting a plateau.
3. **Initial Sensitivity:** Both metrics show the most significant improvement when moving from k=10 to k=20. The rate of improvement slows considerably for higher k values.
4. **Stability at High k:** For k values of 30 and above, the scores for both metrics are remarkably stable, with changes of less than 0.2 points between consecutive steps.
### Interpretation
This chart likely evaluates the performance of a machine learning or information retrieval system where "k" is a key hyperparameter (e.g., number of retrieved documents, nearest neighbors, or clusters).
* **What the data suggests:** Increasing the k value from 10 to 30 yields substantial gains in both F1 (a measure of a test's accuracy, combining precision and recall) and BLEU-1 (a metric for evaluating machine-translated text against reference translations, focusing on unigram precision). Beyond k=30, there are diminishing returns; performance stabilizes or even slightly regresses. This indicates an optimal operating point for k likely lies between 30 and 40 for this specific task and evaluation setup.
* **Relationship between elements:** The parallel trends of F1 and BLEU-1 suggest that the factor "k" influences both aspects of system performance in a similar manner. The consistent gap indicates that the system is inherently better at optimizing for the F1 criterion than for the BLEU-1 criterion under these conditions.
* **Notable anomaly:** The slight dip in F1 at k=50 (26.81) compared to k=40 (27.02) is minimal but could indicate the onset of overfitting or noise introduction as k becomes too large. The BLEU-1 score, however, remains virtually unchanged, suggesting different sensitivity of the metrics to this parameter at its upper range.