# Technical Document Extraction: Bar Chart Analysis
## 1. Labels and Axis Titles
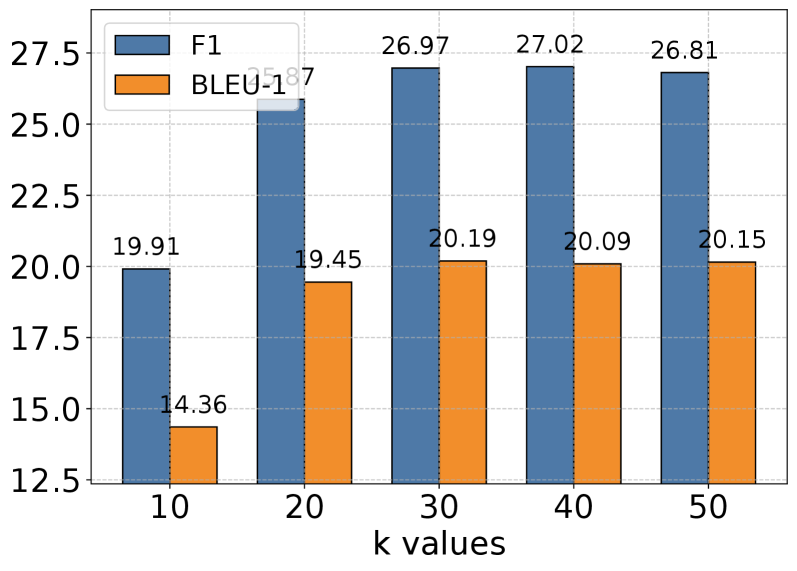
- **X-Axis**: Labeled "k values" with discrete markers at [10, 20, 30, 40, 50].
- **Y-Axis**: Labeled with numerical values ranging from 12.5 to 27.5 in increments of 2.5.
- **Legend**: Located in the top-left corner, with two entries:
- **F1**: Represented by **blue** bars.
- **BLEU-1**: Represented by **orange** bars.
## 2. Data Points and Categories
The chart compares two metrics (**F1** and **BLEU-1**) across five k-values. Extracted data:
| k-value | F1 Score | BLEU-1 Score |
|---------|----------|--------------|
| 10 | 19.91 | 14.36 |
| 20 | 25.87 | 19.45 |
| 30 | 26.97 | 20.19 |
| 40 | 27.02 | 20.09 |
| 50 | 26.81 | 20.15 |
## 3. Visual Trends
- **F1 (Blue Bars)**:
- **Trend**: Increases monotonically from k=10 (19.91) to k=40 (27.02), then slightly decreases at k=50 (26.81).
- **Key Insight**: Peaks at k=40, indicating optimal performance at this k-value.
- **BLEU-1 (Orange Bars)**:
- **Trend**: Gradually increases from k=10 (14.36) to k=30 (20.19), then plateaus with minor fluctuations (20.09 at k=40, 20.15 at k=50).
- **Key Insight**: Stabilizes near 20.15 for k ≥ 30.
## 4. Spatial Grounding
- **Legend Position**: Top-left corner (coordinates: [x=0, y=0] relative to chart boundaries).
- **Bar Alignment**:
- F1 bars (blue) are consistently taller than BLEU-1 bars (orange) for all k-values.
- No overlapping or misaligned data points observed.
## 5. Component Isolation
- **Header**: No explicit header text; legend serves as the primary identifier.
- **Main Chart**:
- Two grouped bar clusters per k-value (F1 and BLEU-1).
- Gridlines visible for reference (horizontal at y=12.5, 15.0, ..., 27.5).
- **Footer**: No footer content.
## 6. Cross-Reference Validation
- **Legend Colors**:
- Blue (F1) matches all blue bars.
- Orange (BLEU-1) matches all orange bars.
- **Data Consistency**: No discrepancies between legend labels and bar colors.
## 7. Additional Observations
- **Scale**: Y-axis uses a linear scale with fixed intervals (2.5 units).
- **Data Range**:
- F1: 19.91 (k=10) to 27.02 (k=40).
- BLEU-1: 14.36 (k=10) to 20.19 (k=30).
- **Missing Data**: No gaps or omitted k-values in the range [10, 50].
## 8. Conclusion
The chart demonstrates that **F1** outperforms **BLEU-1** across all k-values, with both metrics showing diminishing returns beyond k=30. The optimal k-value for F1 is 40, while BLEU-1 stabilizes near k=30.