## Bar Chart: Mathematical Performance Breakdown by Categories
### Overview
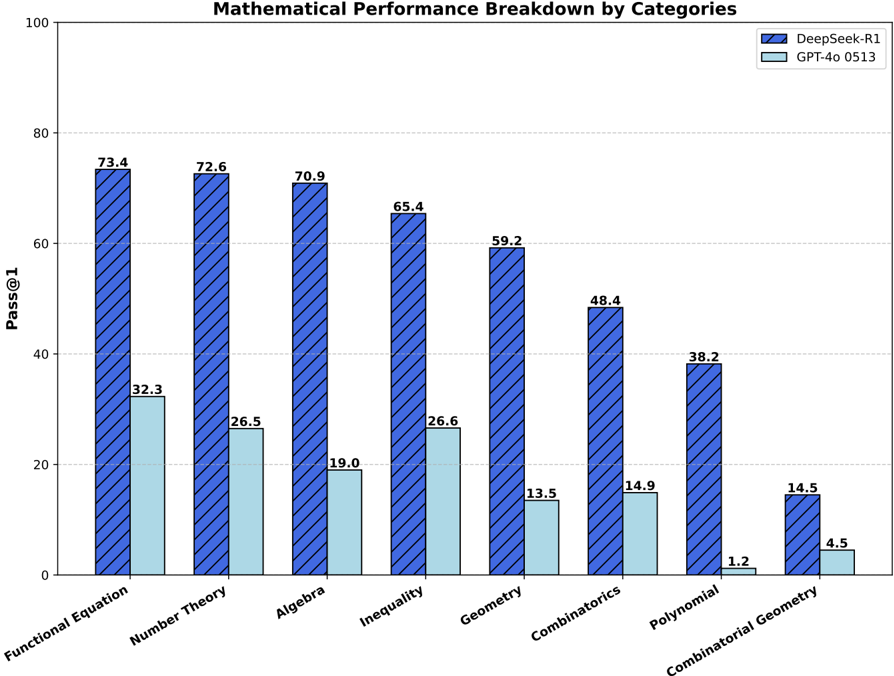
This is a grouped bar chart comparing the performance of two AI models, "DeepSeek-R1" and "GPT-4o 0513," across eight distinct mathematical categories. The performance metric is "Pass@1," likely representing the percentage of problems solved correctly on the first attempt. The chart clearly shows a consistent performance gap between the two models across all categories.
### Components/Axes
* **Chart Title:** "Mathematical Performance Breakdown by Categories" (centered at the top).
* **Y-Axis:**
* **Label:** "Pass@1" (rotated vertically on the left).
* **Scale:** Linear scale from 0 to 100, with major gridlines at intervals of 20 (0, 20, 40, 60, 80, 100).
* **X-Axis:**
* **Categories (from left to right):** Functional Equation, Number Theory, Algebra, Inequality, Geometry, Combinatorics, Polynomial, Combinatorial Geometry.
* **Legend:** Located in the top-right corner.
* **DeepSeek-R1:** Represented by blue bars with a diagonal hatch pattern (\\).
* **GPT-4o 0513:** Represented by solid, light blue (cyan) bars.
* **Data Labels:** The exact "Pass@1" value is printed above each bar.
### Detailed Analysis
The performance values for each category, extracted from the labels above the bars, are as follows:
| Category | DeepSeek-R1 (Blue, Hatched) | GPT-4o 0513 (Light Blue, Solid) |
| :--- | :--- | :--- |
| **Functional Equation** | 73.4 | 32.3 |
| **Number Theory** | 72.6 | 26.5 |
| **Algebra** | 70.9 | 19.0 |
| **Inequality** | 65.4 | 26.6 |
| **Geometry** | 59.2 | 13.5 |
| **Combinatorics** | 48.4 | 14.9 |
| **Polynomial** | 38.2 | 1.2 |
| **Combinatorial Geometry** | 14.5 | 4.5 |
**Trend Verification:**
* **DeepSeek-R1 Trend:** The blue, hatched bars show a clear, consistent downward trend from left to right. Performance starts highest in "Functional Equation" (73.4) and decreases steadily, with the lowest score in "Combinatorial Geometry" (14.5).
* **GPT-4o 0513 Trend:** The light blue, solid bars are consistently lower than their DeepSeek-R1 counterparts. The trend is less linear but generally decreases, with a notable dip in "Polynomial" (1.2) and a slight recovery in "Combinatorial Geometry" (4.5).
### Key Observations
1. **Consistent Superiority:** DeepSeek-R1 outperforms GPT-4o 0513 in every single category by a significant margin.
2. **Performance Gap:** The absolute difference in scores is largest in categories where DeepSeek-R1 performs well (e.g., Functional Equation: 41.1 point gap) and narrows in categories where both models struggle (e.g., Combinatorial Geometry: 10.0 point gap).
3. **Category Difficulty:** Both models find "Combinatorial Geometry" the most challenging category, achieving their lowest scores here (14.5 and 4.5). "Functional Equation" appears to be the easiest category for DeepSeek-R1.
4. **Significant Outlier:** The performance of GPT-4o 0513 on "Polynomial" (1.2) is a dramatic outlier, representing a near-total failure on this category relative to its other scores and to DeepSeek-R1's score of 38.2.
### Interpretation
The data suggests a substantial and consistent difference in mathematical problem-solving capability between the two evaluated models, with DeepSeek-R1 demonstrating markedly higher proficiency across this diverse set of mathematical domains. The downward trend for DeepSeek-R1 indicates that the categories are likely ordered from what the model finds more to less solvable, or from more to less common problem types in its training data.
The relationship between the elements is direct comparison: for each mathematical skill (x-axis category), the chart isolates and contrasts the first-attempt success rate (y-axis) of the two AI systems. The consistent gap implies fundamental differences in their training, architecture, or reasoning capabilities for formal mathematics.
The most critical anomaly is GPT-4o 0513's performance on "Polynomial" problems. A score of 1.2% suggests a specific weakness or a potential mismatch between the model's capabilities and the nature of the polynomial problems in the test set. This warrants further investigation to understand if it's a systemic flaw or an artifact of the evaluation. Overall, the chart serves as strong evidence for the relative mathematical strength of DeepSeek-R1 over GPT-4o 0513 within the context of this specific benchmark.