## Line Chart: MiniCPM-V-2.6 Overall Performance
### Overview
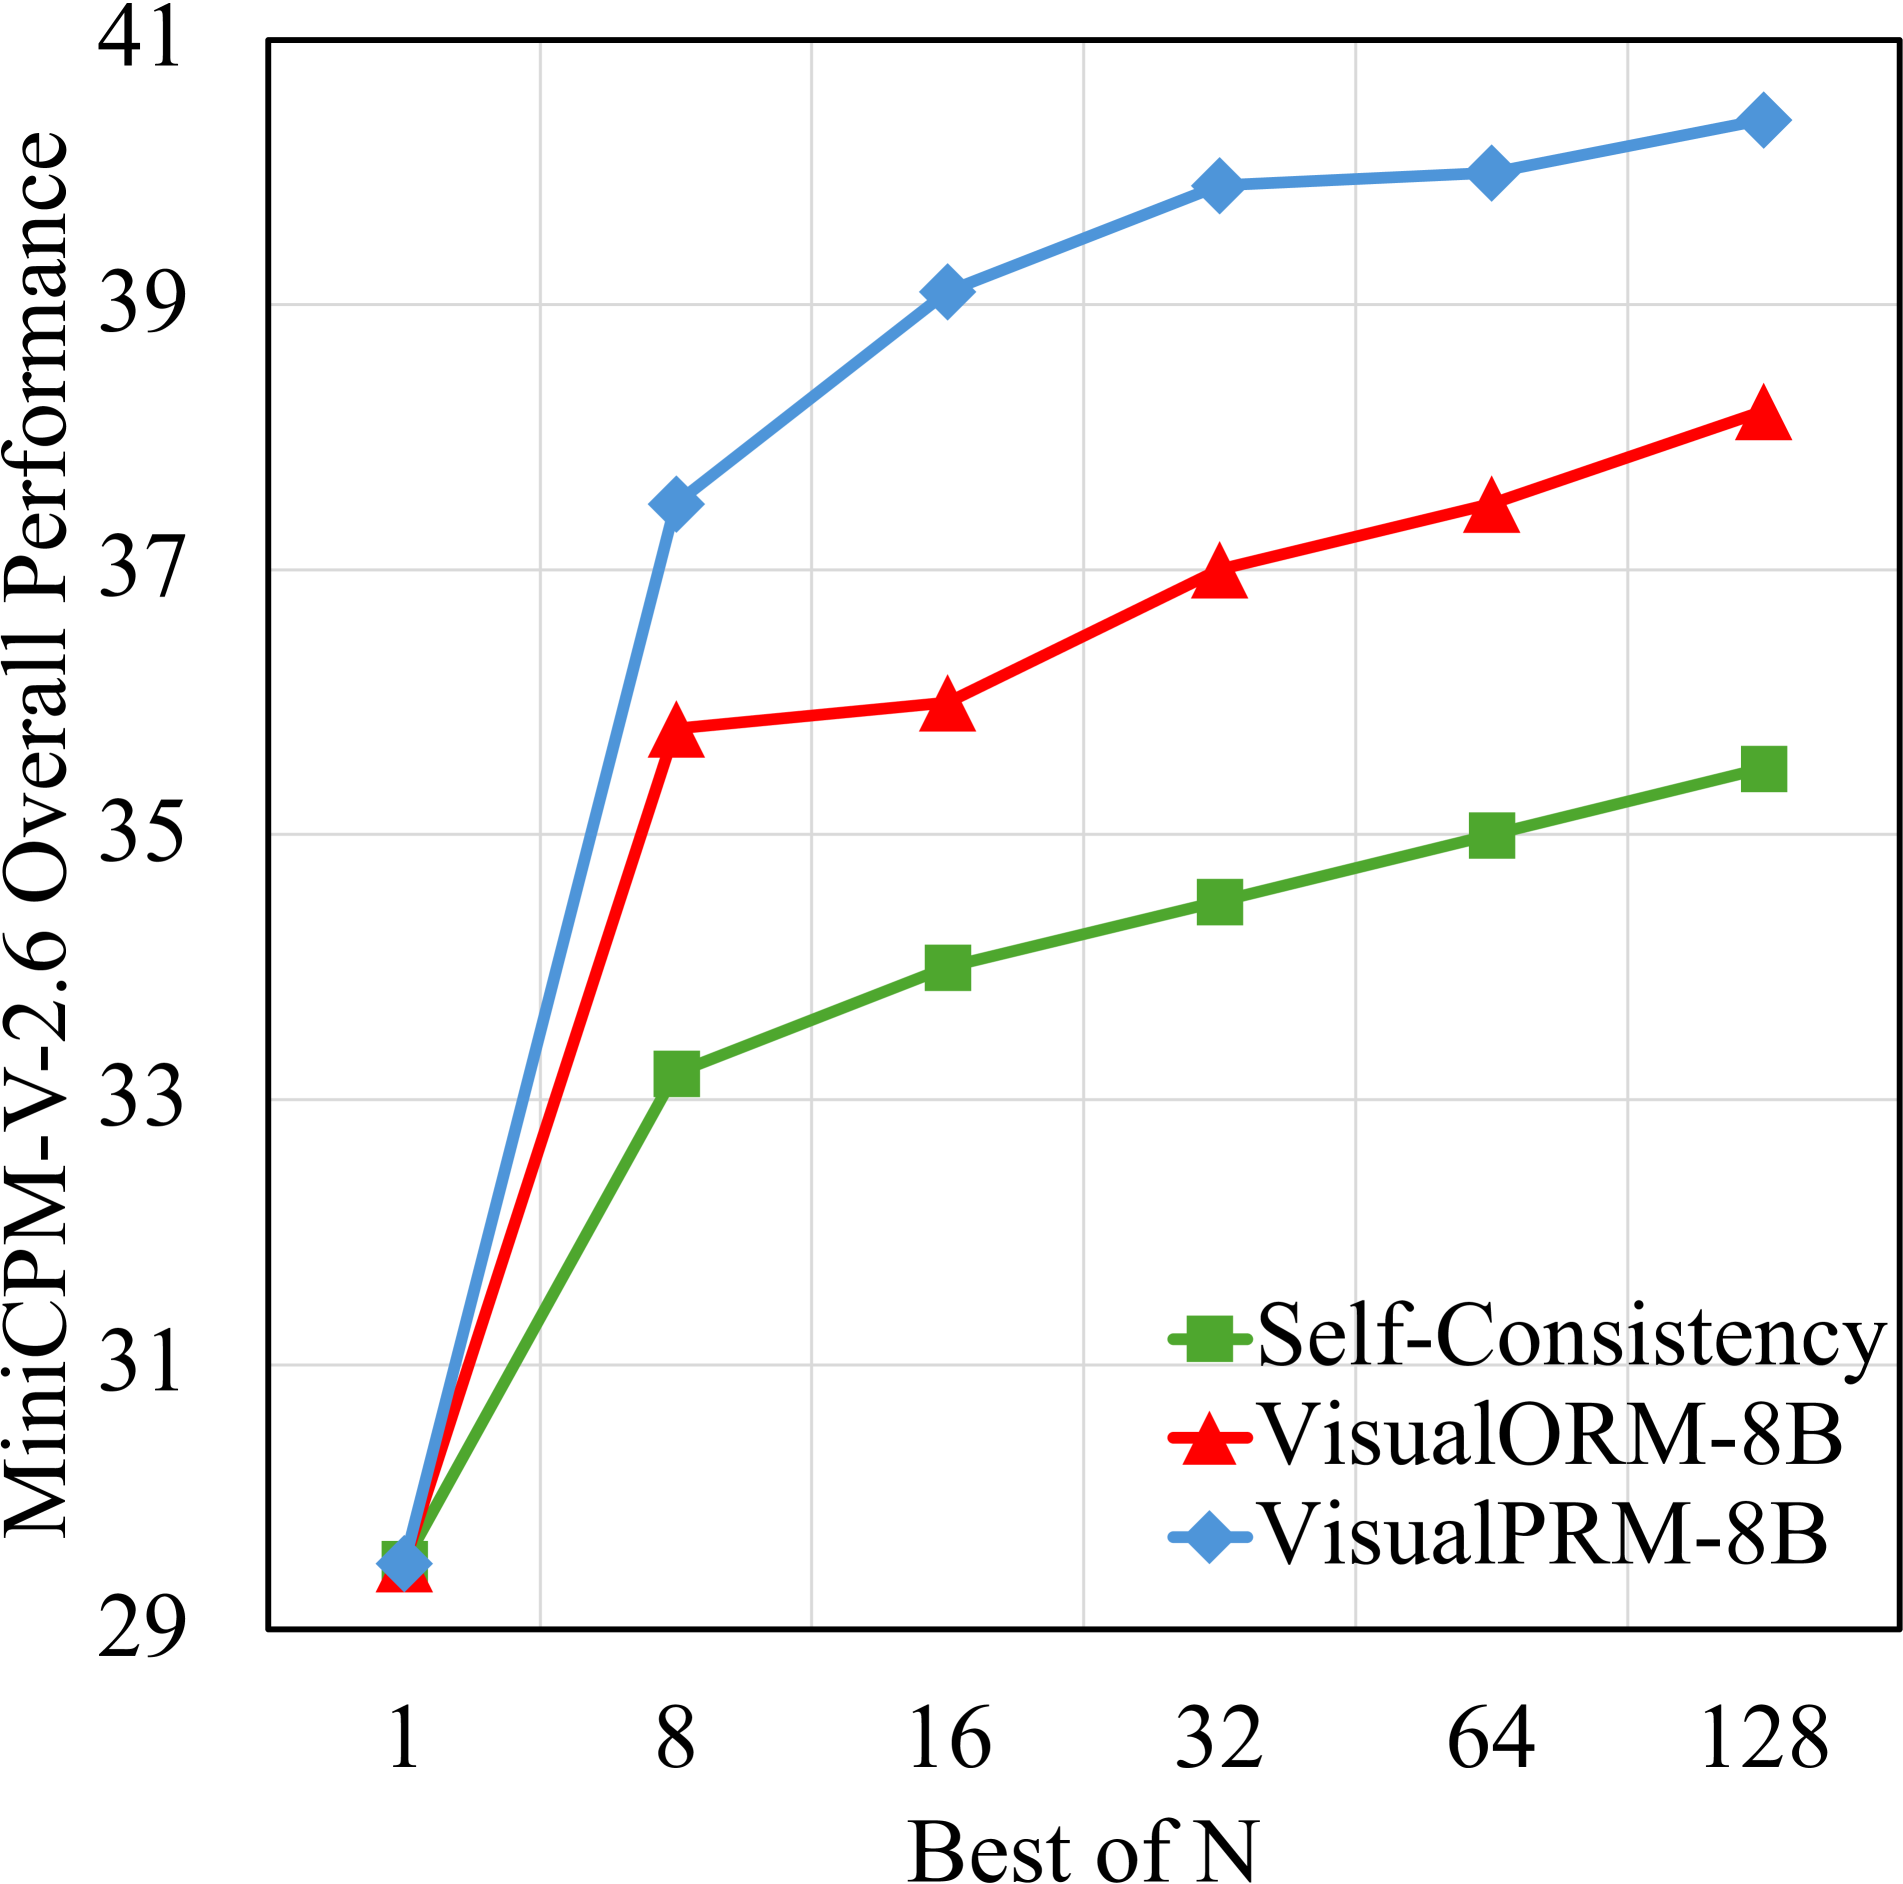
The image is a line chart comparing the overall performance of three different models: Self-Consistency, VisualORM-8B, and VisualPRM-8B. The x-axis represents "Best of N," with values ranging from 1 to 128. The y-axis represents "MiniCPM-V-2.6 Overall Performance," with values ranging from 29 to 41.
### Components/Axes
* **X-axis Title:** Best of N
* **X-axis Scale:** 1, 8, 16, 32, 64, 128
* **Y-axis Title:** MiniCPM-V-2.6 Overall Performance
* **Y-axis Scale:** 29, 31, 33, 35, 37, 39, 41
* **Legend:** Located in the bottom-right corner.
* **Green Line with Square Markers:** Self-Consistency
* **Red Line with Triangle Markers:** VisualORM-8B
* **Blue Line with Diamond Markers:** VisualPRM-8B
### Detailed Analysis
* **Self-Consistency (Green Line):** The line slopes upward, indicating an increase in performance as "Best of N" increases.
* At Best of N = 1, Performance ≈ 29.5
* At Best of N = 8, Performance ≈ 33
* At Best of N = 16, Performance ≈ 34
* At Best of N = 32, Performance ≈ 34.5
* At Best of N = 64, Performance ≈ 35
* At Best of N = 128, Performance ≈ 35.5
* **VisualORM-8B (Red Line):** The line slopes upward, indicating an increase in performance as "Best of N" increases.
* At Best of N = 1, Performance ≈ 29.5
* At Best of N = 8, Performance ≈ 35.5
* At Best of N = 16, Performance ≈ 36
* At Best of N = 32, Performance ≈ 37
* At Best of N = 64, Performance ≈ 37.5
* At Best of N = 128, Performance ≈ 38.5
* **VisualPRM-8B (Blue Line):** The line slopes upward, indicating an increase in performance as "Best of N" increases.
* At Best of N = 1, Performance ≈ 29.5
* At Best of N = 8, Performance ≈ 37.5
* At Best of N = 16, Performance ≈ 39
* At Best of N = 32, Performance ≈ 39.5
* At Best of N = 64, Performance ≈ 39.5
* At Best of N = 128, Performance ≈ 40
### Key Observations
* VisualPRM-8B consistently outperforms the other two models across all values of "Best of N."
* Self-Consistency has the lowest performance among the three models.
* The performance of all three models increases as "Best of N" increases, but the rate of increase varies. VisualPRM-8B shows a steeper initial increase compared to the other two.
### Interpretation
The chart demonstrates the impact of increasing the "Best of N" parameter on the overall performance of three different models. VisualPRM-8B appears to benefit the most from increasing "Best of N," suggesting it is more effective at leveraging multiple samples to improve performance. Self-Consistency shows a more gradual improvement, indicating it may be less sensitive to the "Best of N" parameter. VisualORM-8B falls in between the other two models in terms of performance and sensitivity to "Best of N." The data suggests that VisualPRM-8B is the most effective model overall, while Self-Consistency may be a more stable but less performant option.