## Line Chart: MiniCPM-V-2.6 Overall Performance vs. Best of N
### Overview
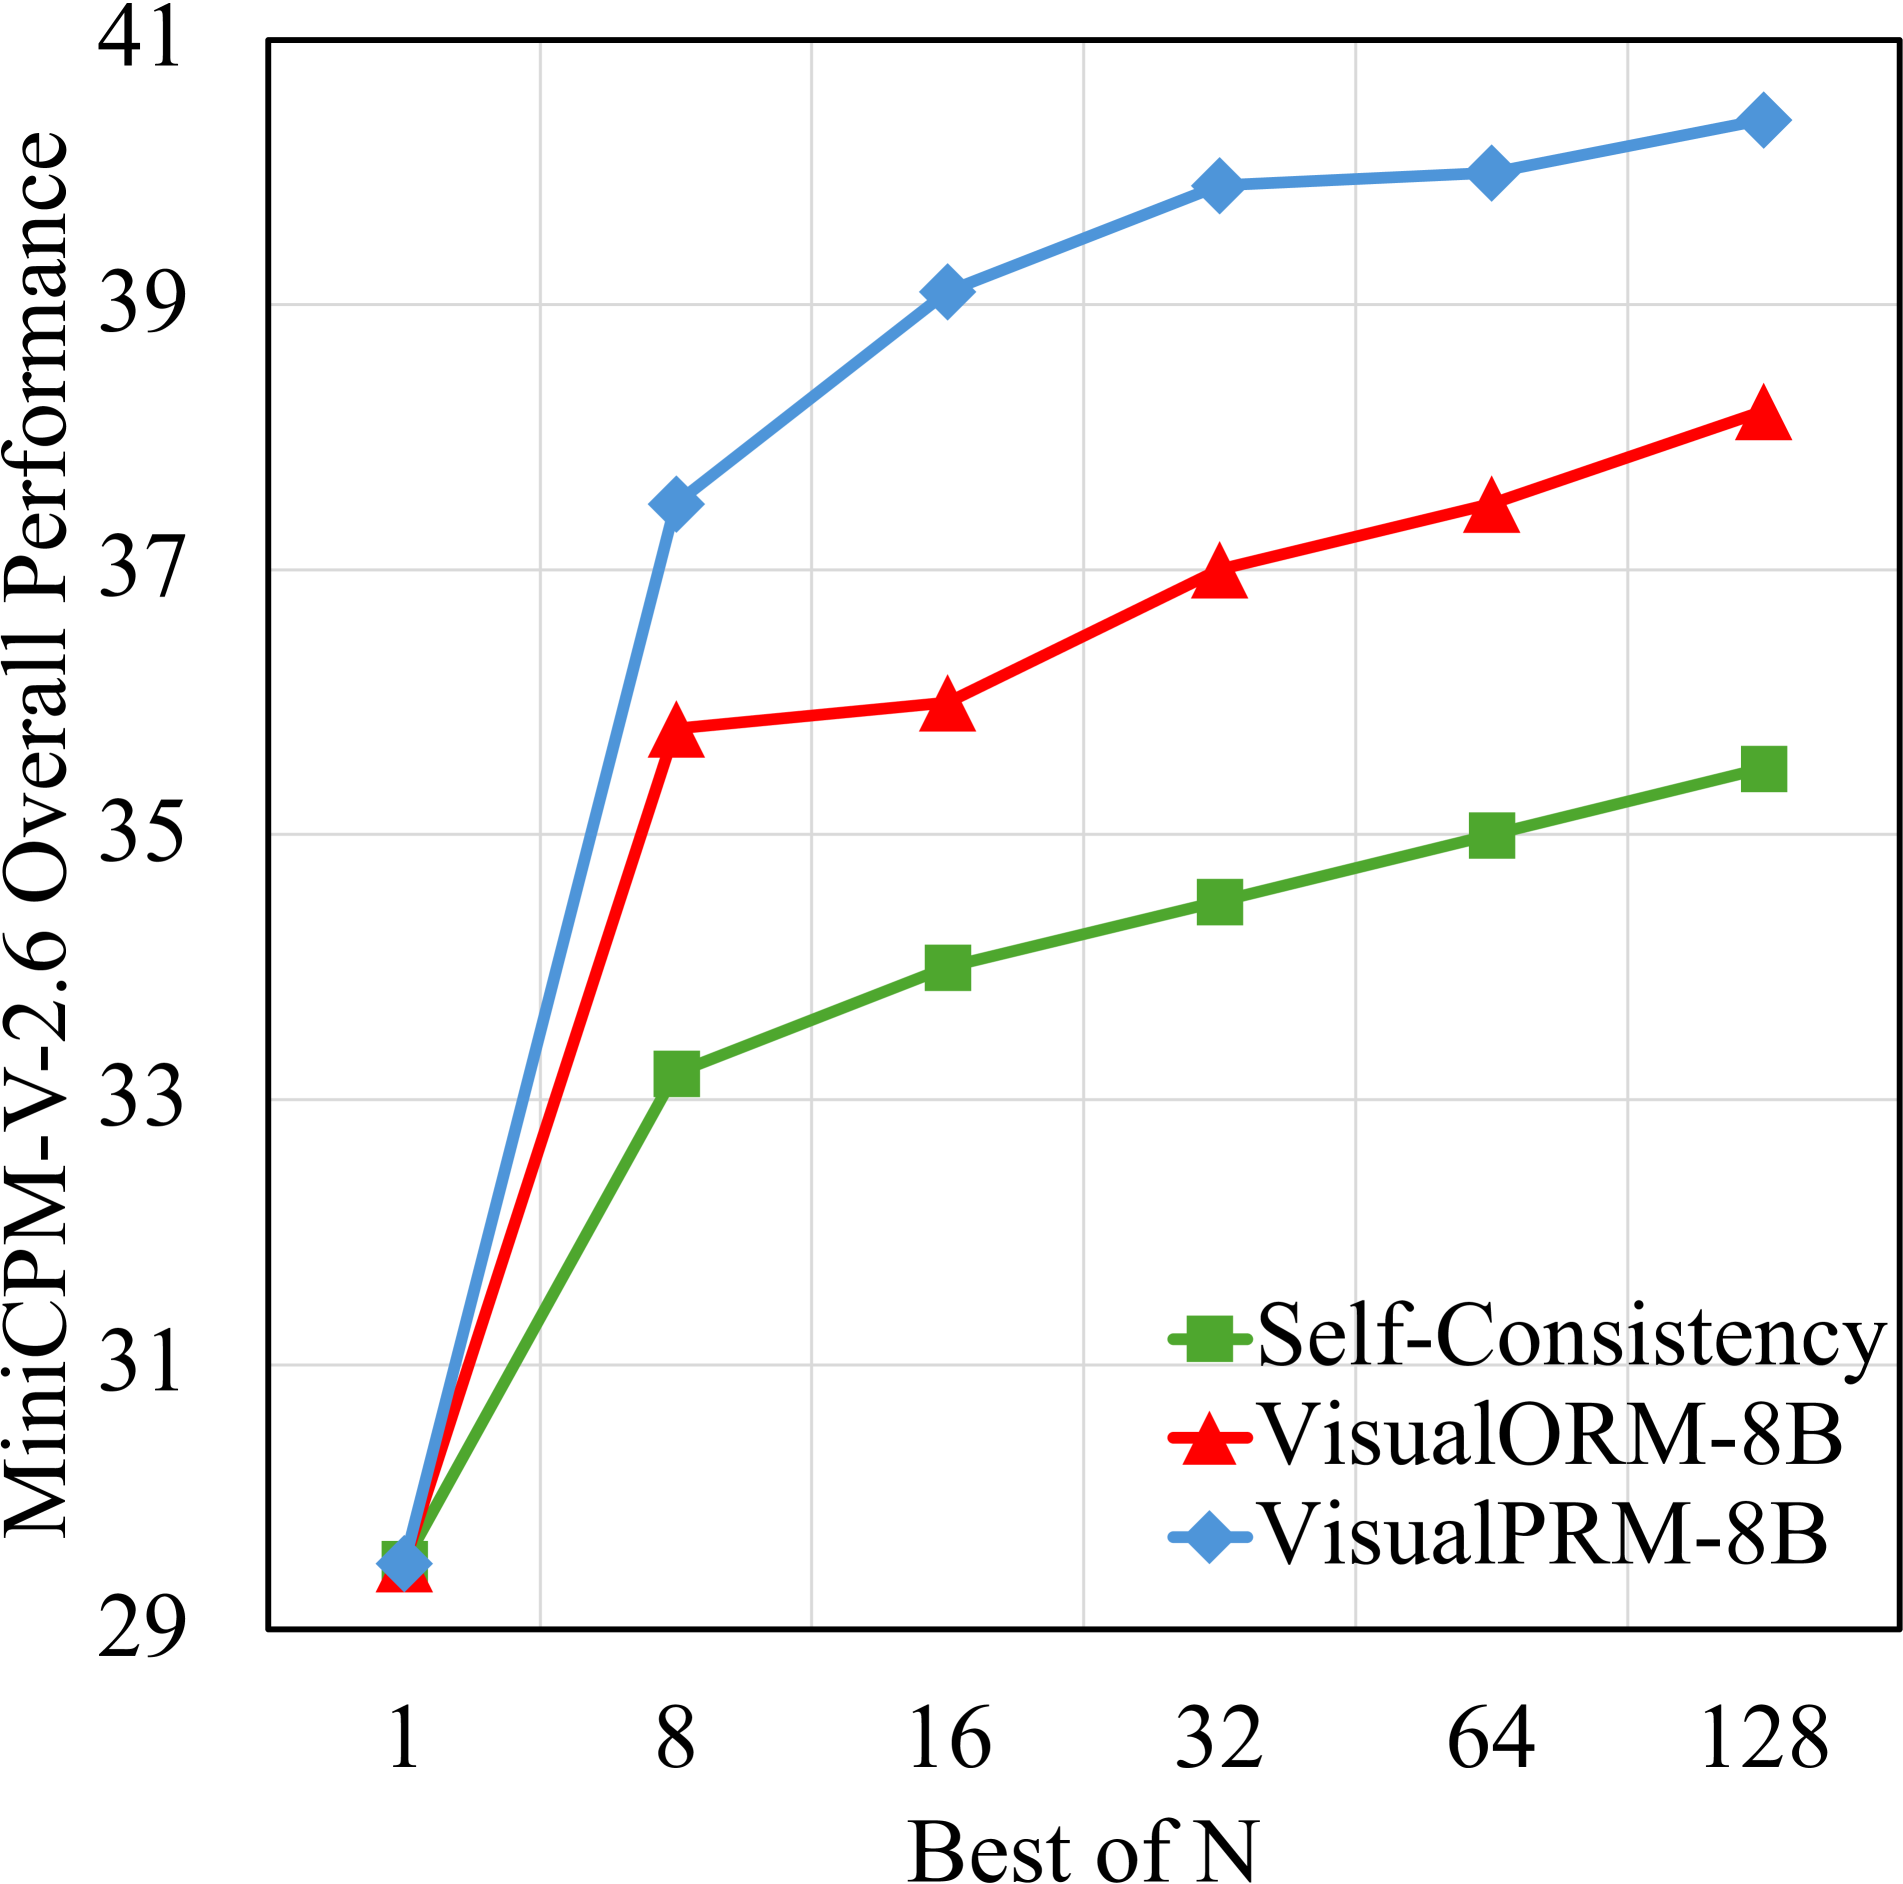
This line chart illustrates the relationship between the "Best of N" parameter and the "MiniCPM-V-2.6 Overall Performance" for three different models: Self-Consistency, VisualORM-8B, and VisualPRM-8B. The chart displays how performance changes as the number of samples ("Best of N") increases.
### Components/Axes
* **X-axis:** "Best of N" - Values are 1, 8, 16, 32, 64, and 128.
* **Y-axis:** "MiniCPM-V-2.6 Overall Performance" - Scale ranges from approximately 29 to 41.
* **Legend:** Located in the top-right corner.
* Self-Consistency (Green squares)
* VisualORM-8B (Red triangles)
* VisualPRM-8B (Blue diamonds)
* **Gridlines:** Present to aid in reading values.
### Detailed Analysis
* **Self-Consistency (Green):** The line slopes upward, indicating increasing performance with increasing "Best of N".
* At N=1, performance is approximately 32.
* At N=8, performance is approximately 33.5.
* At N=16, performance is approximately 34.5.
* At N=32, performance is approximately 35.
* At N=64, performance is approximately 35.5.
* At N=128, performance is approximately 36.
* **VisualORM-8B (Red):** The line shows a steep initial increase, then plateaus.
* At N=1, performance is approximately 30.
* At N=8, performance is approximately 36.
* At N=16, performance is approximately 37.
* At N=32, performance is approximately 37.5.
* At N=64, performance is approximately 38.
* At N=128, performance is approximately 38.5.
* **VisualPRM-8B (Blue):** The line demonstrates a rapid increase initially, followed by a leveling off, achieving the highest performance.
* At N=1, performance is approximately 29.5.
* At N=8, performance is approximately 37.5.
* At N=16, performance is approximately 39.
* At N=32, performance is approximately 39.5.
* At N=64, performance is approximately 40.
* At N=128, performance is approximately 40.5.
### Key Observations
* VisualPRM-8B consistently outperforms both Self-Consistency and VisualORM-8B across all values of "Best of N".
* VisualORM-8B shows the most significant performance gain between N=1 and N=8.
* The performance gains for all models diminish as "Best of N" increases beyond 32.
* Self-Consistency exhibits the slowest rate of performance improvement.
### Interpretation
The data suggests that increasing the number of samples ("Best of N") generally improves the overall performance of these models on the MiniCPM-V-2.6 benchmark. However, the marginal benefit of increasing "Best of N" decreases as the value grows larger. VisualPRM-8B appears to be the most effective model, benefiting substantially from increased sampling, while Self-Consistency shows the least sensitivity to this parameter. This could indicate that VisualPRM-8B is more capable of leveraging information from multiple samples to refine its predictions. The plateauing effect observed at higher values of "Best of N" suggests a point of diminishing returns, where further increasing the number of samples does not yield significant performance improvements. This information is valuable for optimizing the models' configurations and balancing performance gains with computational costs.