## Line Chart: Performance Comparison of Three Methods Across "Best of N" Values
### Overview
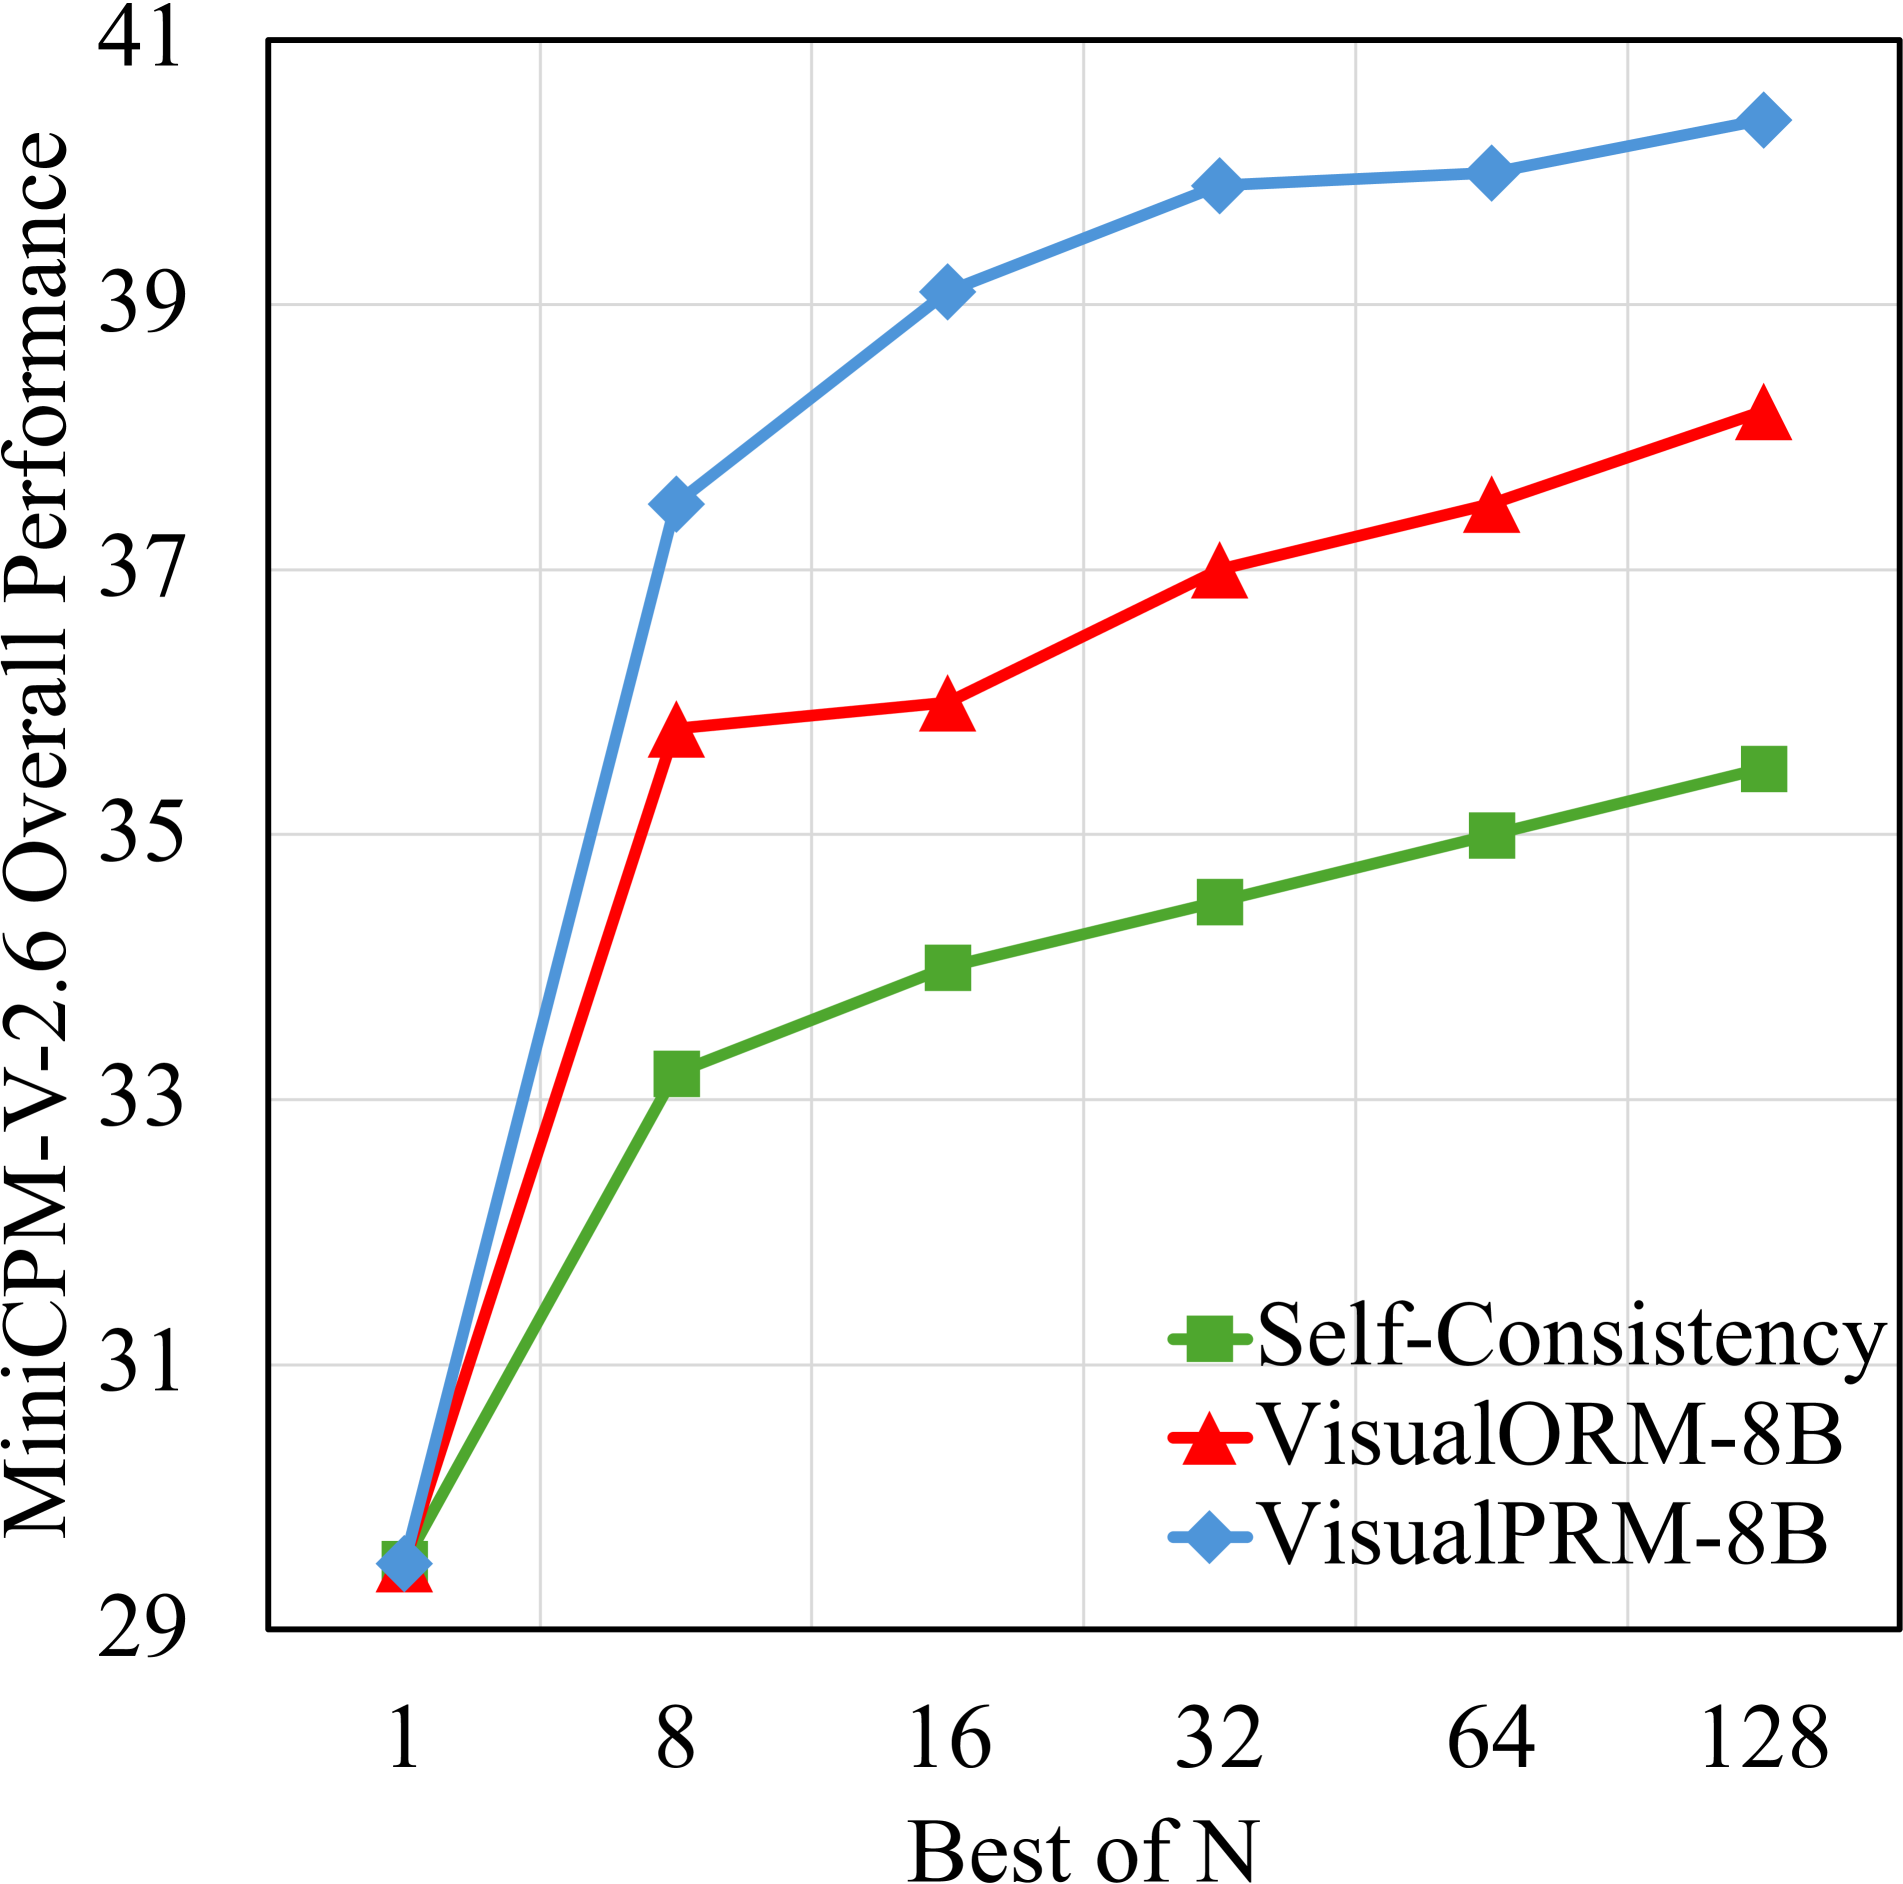
The image displays a line chart comparing the performance of three different methods—Self-Consistency, VisualORM-8B, and VisualPRM-8B—on the "MiniCPM-V-2.6 Overall Performance" metric as a function of the "Best of N" parameter. The chart demonstrates how each method's performance scales as N increases from 1 to 128.
### Components/Axes
* **Chart Type:** Line chart with markers.
* **X-Axis:** Labeled **"Best of N"**. It has discrete, non-linearly spaced tick marks at values: **1, 8, 16, 32, 64, 128**.
* **Y-Axis:** Labeled **"MiniCPM-V-2.6 Overall Performance"**. The scale ranges from **29 to 41**, with major gridlines at intervals of 2 (29, 31, 33, 35, 37, 39, 41).
* **Legend:** Located in the **bottom-right quadrant** of the chart area. It contains three entries:
* **Green Square Marker:** Labeled **"Self-Consistency"**.
* **Red Triangle Marker:** Labeled **"VisualORM-8B"**.
* **Blue Diamond Marker:** Labeled **"VisualPRM-8B"**.
* **Grid:** A light gray grid is present in the background.
### Detailed Analysis
**Data Series and Trends:**
1. **VisualPRM-8B (Blue Diamond Line):**
* **Trend:** Shows the steepest initial increase and achieves the highest overall performance. The line slopes sharply upward from N=1 to N=8, continues to rise steadily until N=32, and then plateaus with very slight increases.
* **Approximate Data Points:**
* N=1: ~29.5
* N=8: ~37.5
* N=16: ~39.0
* N=32: ~40.0
* N=64: ~40.0
* N=128: ~40.5
2. **VisualORM-8B (Red Triangle Line):**
* **Trend:** Shows a strong, steady upward trend across all N values, consistently performing below VisualPRM-8B but above Self-Consistency. The growth rate is more linear compared to the blue line.
* **Approximate Data Points:**
* N=1: ~29.5
* N=8: ~35.5
* N=16: ~36.0
* N=32: ~37.0
* N=64: ~37.5
* N=128: ~38.0
3. **Self-Consistency (Green Square Line):**
* **Trend:** Shows the most gradual increase and the lowest performance among the three methods. The line has a consistent, moderate upward slope.
* **Approximate Data Points:**
* N=1: ~29.5
* N=8: ~33.0
* N=16: ~34.0
* N=32: ~34.5
* N=64: ~35.0
* N=128: ~35.5
### Key Observations
* **Common Starting Point:** All three methods begin at approximately the same performance level (~29.5) when N=1.
* **Divergence with N:** Performance diverges significantly as N increases. The gap between the best (VisualPRM-8B) and worst (Self-Consistency) performer widens substantially.
* **Diminishing Returns:** All curves show signs of diminishing returns. The performance gain from doubling N is largest in the early steps (e.g., N=1 to N=8) and becomes progressively smaller, especially for VisualPRM-8B after N=32.
* **Performance Hierarchy:** A clear and consistent hierarchy is established from N=8 onward: **VisualPRM-8B > VisualORM-8B > Self-Consistency**.
### Interpretation
The chart illustrates the effectiveness of different methods for improving the performance of the MiniCPM-V-2.6 model when leveraging multiple samples or attempts (the "Best of N" strategy).
* **Method Superiority:** VisualPRM-8B is the most effective method shown, providing the largest performance boost for any given N > 1. This suggests its underlying mechanism for selecting or aggregating the "best" result is superior to the other two approaches.
* **Value of Scaling N:** Increasing N universally improves performance for all methods, confirming the benefit of generating and evaluating more candidates. However, the cost-benefit ratio decreases as N grows large.
* **Practical Implication:** For resource-constrained scenarios, a moderate N (like 16 or 32) with VisualPRM-8B may offer the best trade-off between performance gain and computational cost. For maximum performance regardless of cost, VisualPRM-8B with N=128 is the optimal choice among the presented options.
* **Underlying Mechanism:** The significant gap between VisualPRM-8B/VisualORM-8B and Self-Consistency implies that the former two methods, likely involving more sophisticated reward modeling or process-based verification (as suggested by "ORM" and "PRM" in their names), are more capable of identifying high-quality outputs than a simple self-consistency (majority voting) approach.