## Line Chart: MiniCPM-V-2.6 Overall Performance vs. Best of N
### Overview
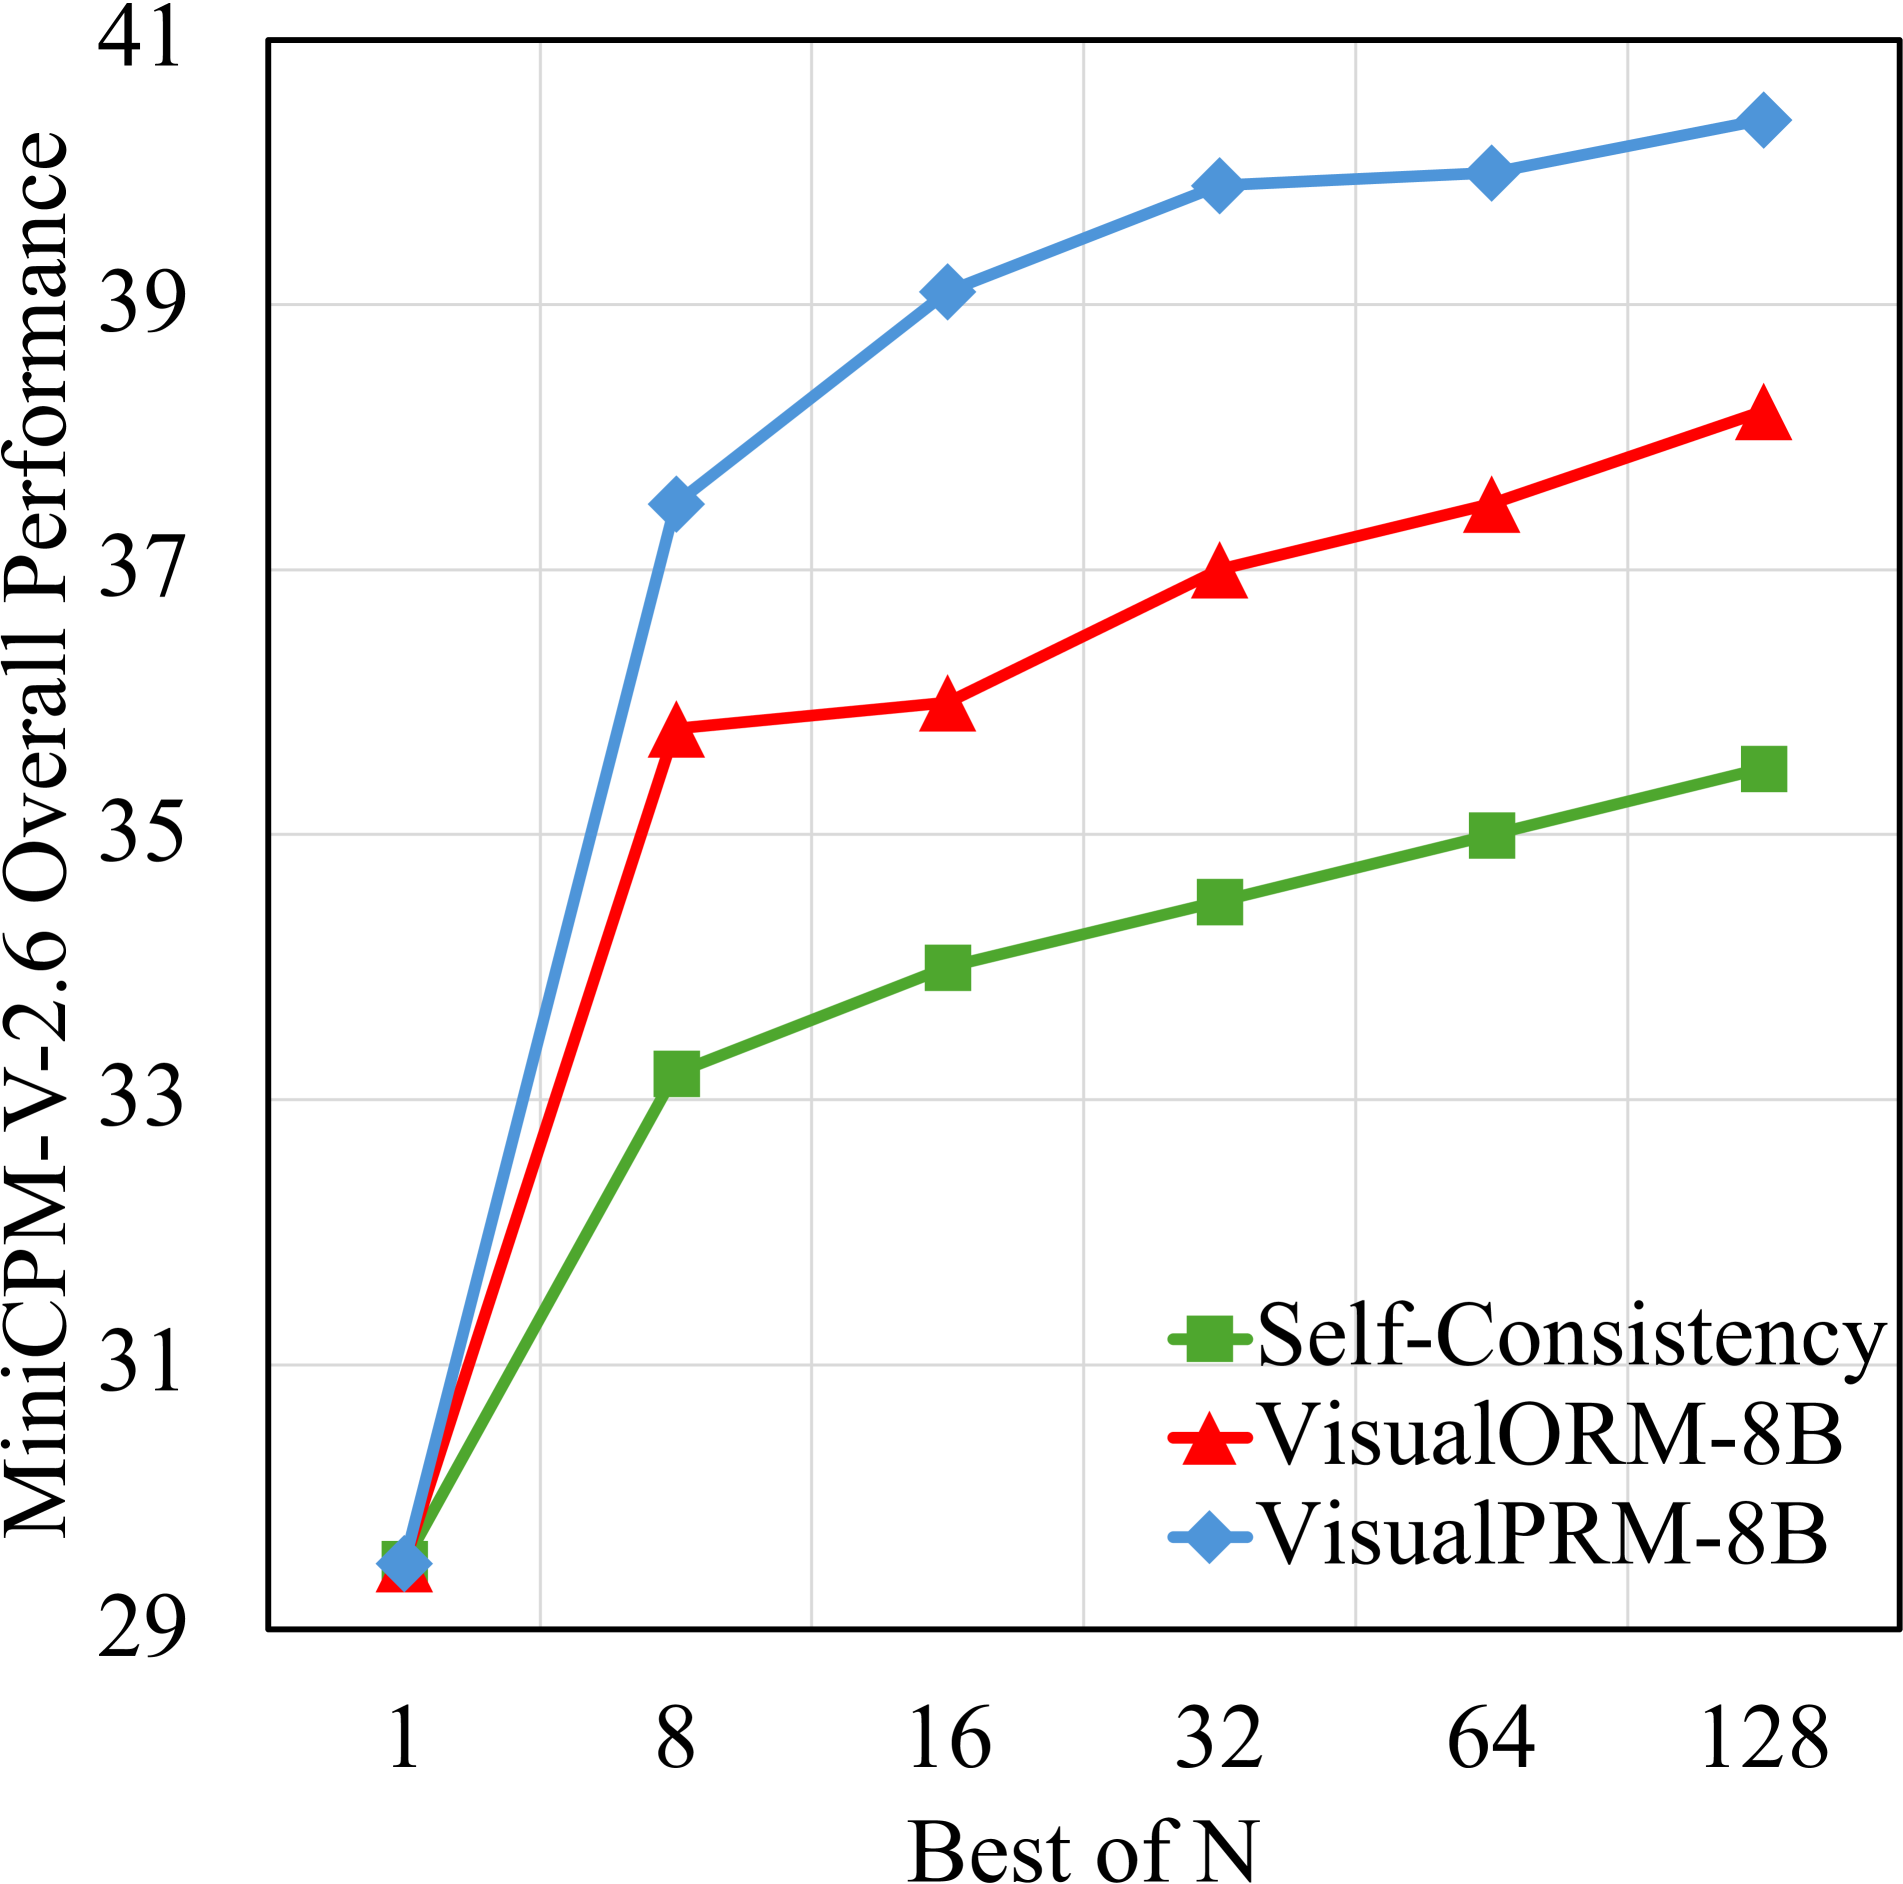
The chart compares the performance of three methods (Self-Consistency, VisualORM-8B, VisualPRM-8B) across increasing "Best of N" values (1, 8, 16, 32, 64, 128). Performance is measured on the MiniCPM-V-2.6 Overall Performance scale (29–41). All three methods show upward trends, with VisualPRM-8B achieving the highest performance at larger N values.
### Components/Axes
- **X-axis**: "Best of N" (logarithmic scale: 1, 8, 16, 32, 64, 128)
- **Y-axis**: "MiniCPM-V-2.6 Overall Performance" (linear scale: 29–41)
- **Legend**: Located on the right, with:
- Green squares: Self-Consistency
- Red triangles: VisualORM-8B
- Blue diamonds: VisualPRM-8B
### Detailed Analysis
1. **Self-Consistency (Green Squares)**:
- Starts at ~29.1 (N=1) and increases to ~35.6 (N=128).
- Gradual, linear growth with minimal curvature.
- Uncertainty: ±0.2 at all points.
2. **VisualORM-8B (Red Triangles)**:
- Begins at ~29.0 (N=1) and rises to ~38.0 (N=128).
- Steeper initial slope (N=1→8: +7.0) followed by slower growth.
- Uncertainty: ±0.3 at all points.
3. **VisualPRM-8B (Blue Diamonds)**:
- Starts at ~29.0 (N=1) and peaks at ~40.0 (N=128).
- Sharp initial increase (N=1→8: +8.0), then plateaus.
- Uncertainty: ±0.4 at all points.
### Key Observations
- **Performance Correlation**: All methods improve with larger N, but VisualPRM-8B dominates at N≥32.
- **Diminishing Returns**: VisualPRM-8B’s performance plateaus after N=32, suggesting saturation.
- **Self-Consistency Lag**: The green line shows the slowest growth, indicating lower sensitivity to N.
### Interpretation
The data demonstrates that increasing the number of samples (Best of N) enhances performance across all methods. VisualPRM-8B achieves the highest gains, particularly at larger N values, but its performance stabilizes after N=32. Self-Consistency’s slower growth suggests it may rely less on iterative refinement compared to the other methods. The steep initial rise for VisualPRM-8B implies significant early-stage improvements, while its plateau indicates diminishing returns at scale. This could inform resource allocation for optimization tasks, favoring methods with higher scalability (e.g., VisualPRM-8B) for large N scenarios.