\n
## Line Chart: Answer Accuracy vs. Layer for Llama Models
### Overview
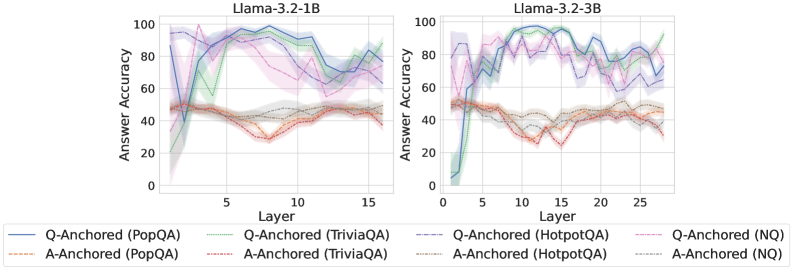
This image presents two line charts comparing the answer accuracy of different question-answering datasets (PopQA, TriviaQA, HotpotQA, and NQ) across layers in two Llama models: Llama-3.2-1B and Llama-3.2-3B. The charts display accuracy as a function of layer number, with shaded areas representing confidence intervals.
### Components/Axes
* **X-axis:** Layer (ranging from approximately 0 to 15 for the 1B model and 0 to 25 for the 3B model).
* **Y-axis:** Answer Accuracy (ranging from 0 to 100).
* **Left Chart Title:** Llama-3.2-1B
* **Right Chart Title:** Llama-3.2-3B
* **Legend:** Located at the bottom of the image. The legend contains the following entries:
* Blue Solid Line: Q-Anchored (PopQA)
* Orange Solid Line: A-Anchored (PopQA)
* Green Solid Line: Q-Anchored (TriviaQA)
* Light Blue Dashed Line: Q-Anchored (HotpotQA)
* Brown Solid Line: A-Anchored (TriviaQA)
* Gray Solid Line: A-Anchored (HotpotQA)
* Purple Solid Line: Q-Anchored (NQ)
* Red Solid Line: A-Anchored (NQ)
### Detailed Analysis or Content Details
**Llama-3.2-1B Chart (Left)**
* **Q-Anchored (PopQA) - Blue Line:** Starts at approximately 90% accuracy at layer 0, rises to a peak of around 98% between layers 6 and 10, then declines to approximately 85% at layer 15.
* **A-Anchored (PopQA) - Orange Line:** Starts at approximately 30% accuracy at layer 0, rises to a peak of around 45% between layers 6 and 8, then declines to approximately 30% at layer 15.
* **Q-Anchored (TriviaQA) - Green Line:** Starts at approximately 70% accuracy at layer 0, rises to a peak of around 95% between layers 6 and 10, then declines to approximately 80% at layer 15.
* **Q-Anchored (HotpotQA) - Light Blue Dashed Line:** Starts at approximately 40% accuracy at layer 0, rises to a peak of around 70% between layers 6 and 10, then declines to approximately 50% at layer 15.
* **A-Anchored (TriviaQA) - Brown Line:** Starts at approximately 30% accuracy at layer 0, rises to a peak of around 40% between layers 6 and 8, then declines to approximately 30% at layer 15.
* **A-Anchored (HotpotQA) - Gray Line:** Starts at approximately 20% accuracy at layer 0, rises to a peak of around 35% between layers 6 and 8, then declines to approximately 25% at layer 15.
* **Q-Anchored (NQ) - Purple Line:** Starts at approximately 80% accuracy at layer 0, rises to a peak of around 95% between layers 6 and 10, then declines to approximately 85% at layer 15.
* **A-Anchored (NQ) - Red Line:** Starts at approximately 30% accuracy at layer 0, rises to a peak of around 45% between layers 6 and 8, then declines to approximately 30% at layer 15.
**Llama-3.2-3B Chart (Right)**
* **Q-Anchored (PopQA) - Blue Line:** Starts at approximately 90% accuracy at layer 0, fluctuates between 80% and 95% with peaks around layers 5, 10, 15, and 20, then declines to approximately 80% at layer 25.
* **A-Anchored (PopQA) - Orange Line:** Starts at approximately 30% accuracy at layer 0, rises to a peak of around 45% between layers 6 and 8, then fluctuates between 30% and 50% and declines to approximately 35% at layer 25.
* **Q-Anchored (TriviaQA) - Green Line:** Starts at approximately 70% accuracy at layer 0, rises to a peak of around 95% between layers 6 and 10, then fluctuates between 70% and 90% and declines to approximately 75% at layer 25.
* **Q-Anchored (HotpotQA) - Light Blue Dashed Line:** Starts at approximately 40% accuracy at layer 0, rises to a peak of around 70% between layers 6 and 10, then fluctuates between 50% and 70% and declines to approximately 60% at layer 25.
* **A-Anchored (TriviaQA) - Brown Line:** Starts at approximately 30% accuracy at layer 0, rises to a peak of around 40% between layers 6 and 8, then fluctuates between 30% and 45% and declines to approximately 35% at layer 25.
* **A-Anchored (HotpotQA) - Gray Line:** Starts at approximately 20% accuracy at layer 0, rises to a peak of around 35% between layers 6 and 8, then fluctuates between 20% and 35% and declines to approximately 25% at layer 25.
* **Q-Anchored (NQ) - Purple Line:** Starts at approximately 80% accuracy at layer 0, rises to a peak of around 95% between layers 6 and 10, then fluctuates between 70% and 90% and declines to approximately 75% at layer 25.
* **A-Anchored (NQ) - Red Line:** Starts at approximately 30% accuracy at layer 0, rises to a peak of around 45% between layers 6 and 8, then fluctuates between 30% and 50% and declines to approximately 35% at layer 25.
### Key Observations
* The "Q-Anchored" lines consistently outperform the "A-Anchored" lines across all datasets and models.
* Accuracy generally increases with layer number up to a certain point (around layers 6-10), after which it plateaus or declines.
* The 3B model exhibits more fluctuation in accuracy across layers compared to the 1B model.
* PopQA and NQ datasets generally have higher accuracy scores than TriviaQA and HotpotQA.
### Interpretation
The charts demonstrate the impact of model depth (layers) on answer accuracy for different question-answering datasets. The superior performance of "Q-Anchored" approaches suggests that anchoring the model's attention to the question itself is more effective than anchoring it to the answer. The initial increase in accuracy with layer number indicates that deeper models can capture more complex relationships in the data. However, the subsequent plateau or decline suggests that adding more layers beyond a certain point may not lead to further improvements and could even introduce overfitting or other issues. The differences in accuracy across datasets likely reflect the inherent difficulty of each dataset. The 3B model's greater fluctuation could be attributed to its increased capacity to learn complex patterns, but also its greater susceptibility to noise or overfitting. Overall, the data suggests that model depth is an important factor in answer accuracy, but it must be carefully balanced with other considerations such as dataset complexity and the anchoring strategy employed.