TECHNICAL ASSET FINGERPRINT
00d59a86ddd50534e74301bb
Click to view fullscreen
Press ESC or click to close
FOUND IN PAPERS
EXPERT: healer-alpha-free VERSION 1
RUNTIME: free/openrouter/healer-alpha
INTEL_VERIFIED
\n
## Line Charts: Answer Accuracy Across Layers for Llama-3.2 Models
### Overview
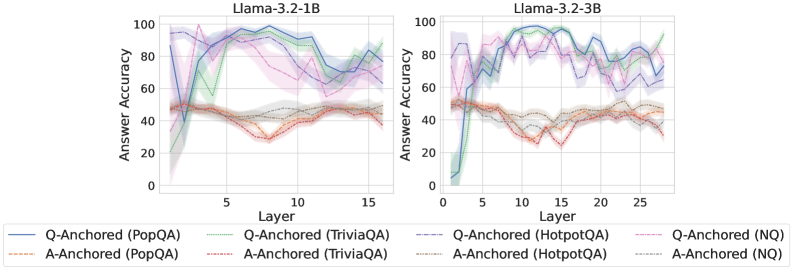
The image displays two side-by-side line charts comparing the "Answer Accuracy" of two language models, Llama-3.2-1B and Llama-3.2-3B, across their internal layers. Each chart plots the performance of eight different evaluation configurations, defined by an anchoring method (Q-Anchored or A-Anchored) and a dataset (PopQA, TriviaQA, HotpotQA, NQ).
### Components/Axes
* **Chart Titles:** "Llama-3.2-1B" (left chart), "Llama-3.2-3B" (right chart).
* **X-Axis:** Labeled "Layer". The left chart (1B model) has ticks at 5, 10, and 15, with data plotted from approximately layer 1 to 16. The right chart (3B model) has ticks at 5, 10, 15, 20, and 25, with data plotted from approximately layer 1 to 27.
* **Y-Axis:** Labeled "Answer Accuracy". Both charts share the same scale from 0 to 100, with major ticks at 0, 20, 40, 60, 80, and 100.
* **Legend:** Positioned at the bottom center of the image, spanning both charts. It defines eight data series:
1. `Q-Anchored (PopQA)`: Solid blue line.
2. `Q-Anchored (TriviaQA)`: Solid green line.
3. `Q-Anchored (HotpotQA)`: Dashed blue line.
4. `Q-Anchored (NQ)`: Dashed pink line.
5. `A-Anchored (PopQA)`: Dashed orange line.
6. `A-Anchored (TriviaQA)`: Dashed red line.
7. `A-Anchored (HotpotQA)`: Dotted grey line.
8. `A-Anchored (NQ)`: Dotted teal line.
* **Data Series:** Each series is represented by a line with a shaded region, likely indicating confidence intervals or standard deviation across multiple runs.
### Detailed Analysis: Llama-3.2-1B (Left Chart)
* **Q-Anchored Series (Solid/Dashed Lines):** These lines generally start at low accuracy (below 20) in the earliest layers, rise sharply to a peak between layers 5-10, and then exhibit a gradual decline or fluctuation in later layers.
* `Q-Anchored (TriviaQA)` (Solid Green): Shows the highest peak, reaching near 100% accuracy around layer 7-8. It then declines to approximately 70% by layer 16.
* `Q-Anchored (PopQA)` (Solid Blue): Peaks around 95% near layer 8, then declines to about 80% by layer 16.
* `Q-Anchored (NQ)` (Dashed Pink): Peaks around 90% near layer 7, then shows a more pronounced decline to roughly 60% by layer 16.
* `Q-Anchored (HotpotQA)` (Dashed Blue): Follows a similar pattern to PopQA but with slightly lower peak accuracy (~85%).
* **A-Anchored Series (Dashed/Dotted Lines):** These lines show significantly less variation across layers. They start at a moderate accuracy (around 40-50%) and remain relatively flat, with a slight downward trend in the middle layers (5-10) before recovering.
* All four A-Anchored series (`PopQA`, `TriviaQA`, `HotpotQA`, `NQ`) cluster tightly between approximately 30% and 50% accuracy throughout all layers. `A-Anchored (TriviaQA)` (Dashed Red) appears to be the lowest-performing, dipping to near 30% around layer 8.
### Detailed Analysis: Llama-3.2-3B (Right Chart)
* **Q-Anchored Series:** The pattern is similar to the 1B model but with higher overall accuracy and more pronounced volatility in later layers.
* `Q-Anchored (TriviaQA)` (Solid Green): Again achieves the highest peak, reaching nearly 100% around layer 10. It shows significant drops and recoveries, ending near 90% at layer 27.
* `Q-Anchored (PopQA)` (Solid Blue): Peaks near 95% around layer 10, then fluctuates between 70-90% in later layers.
* `Q-Anchored (NQ)` (Dashed Pink): Peaks around 90% near layer 8, then declines more steeply than the 1B model, falling to approximately 60% by layer 27.
* `Q-Anchored (HotpotQA)` (Dashed Blue): Follows a pattern between PopQA and NQ.
* **A-Anchored Series:** These lines are again clustered and relatively flat, but sit at a slightly lower accuracy band (approximately 25-45%) compared to the 1B model. They exhibit a shallow dip in the middle layers (around layers 10-15).
### Key Observations
1. **Anchoring Method Dominance:** The most striking pattern is the large performance gap between Q-Anchored and A-Anchored evaluations. Q-Anchored methods consistently yield much higher accuracy, especially in the middle layers.
2. **Layer Sensitivity:** Q-Anchored accuracy is highly sensitive to layer depth, showing a characteristic "rise-peak-decline" pattern. A-Anchored accuracy is largely insensitive to layer.
3. **Model Size Effect:** The larger 3B model achieves similar or slightly higher peak accuracies than the 1B model but exhibits more volatility in later layers for Q-Anchored evaluations. The A-Anchored performance is slightly worse in the 3B model.
4. **Dataset Variation:** For Q-Anchored evaluations, TriviaQA consistently yields the highest accuracy, followed by PopQA, HotpotQA, and NQ. This hierarchy is less distinct for A-Anchored evaluations.
### Interpretation
The data suggests a fundamental difference in how information is processed and utilized within the model's layers depending on the evaluation setup.
* **Q-Anchored vs. A-Anchored:** The "Q-Anchored" setup likely provides the model with a direct question or query at each layer, allowing it to dynamically retrieve and refine an answer. The strong layer dependence indicates that the model's internal representations for answering questions are most potent in the middle layers and may become less task-specific or more abstract in the final layers. The "A-Anchored" setup, which may provide an answer cue, appears to bypass this dynamic retrieval process, leading to stable but mediocre performance that doesn't benefit from the model's deeper processing.
* **The "Sweet Spot":** The middle layers (roughly 5-10 for 1B, 8-15 for 3B) appear to be a "sweet spot" for question-answering capability when the model is queried appropriately (Q-Anchored). This could be where factual knowledge is most accessibly encoded.
* **Model Scaling:** Increasing model size from 1B to 3B parameters does not fundamentally change the processing pattern but may increase the capacity for high accuracy (higher peaks) at the cost of less stable representations in deeper layers (greater volatility).
* **Dataset Difficulty:** The consistent performance hierarchy across datasets (TriviaQA > PopQA > HotpotQA > NQ) for Q-Anchored evaluations suggests these datasets vary in difficulty or in how well their question-answer pairs align with the model's pre-training knowledge.
**In summary, the charts demonstrate that the internal processing of a Llama-3.2 model for factual question answering is highly dependent on both the layer being probed and the method of probing. The model's middle layers contain the most potent task-specific representations, but accessing them effectively requires a query-based (Q-Anchored) approach.**
DECODING INTELLIGENCE...