## Line Graph: Answer Accuracy Across Layers for Llama-3.2 Models
### Overview
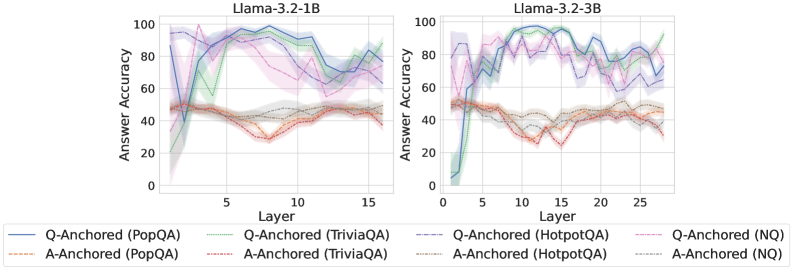
The image contains two side-by-side line graphs comparing answer accuracy across transformer model layers for two Llama-3.2 variants (1B and 3B parameter sizes). Each graph shows multiple data series representing different question/answer anchoring methods across four datasets (PopQA, TriviaQA, HotpotQA, NQ). The graphs use color-coded lines with shaded confidence intervals to visualize performance trends.
### Components/Axes
- **X-axis (Layer)**:
- Left chart: 0–15 (Llama-3.2-1B)
- Right chart: 0–25 (Llama-3.2-3B)
- Discrete integer increments
- **Y-axis (Answer Accuracy)**:
- Range: 0–100% (linear scale)
- Labeled "Answer Accuracy"
- **Legends**:
- Positioned at bottom of each chart
- Color-coded line styles:
- Solid lines: Q-Anchored methods
- Dashed lines: A-Anchored methods
- Dataset labels:
- PopQA (blue/orange)
- TriviaQA (green/red)
- HotpotQA (purple/gray)
- NQ (pink/black)
### Detailed Analysis
#### Llama-3.2-1B (Left Chart)
- **Q-Anchored (PopQA)**:
- Blue solid line
- Starts at ~90% accuracy (Layer 0)
- Sharp drop to ~40% at Layer 5
- Recovers to ~80% by Layer 15
- Confidence interval: ±5% (shaded blue)
- **A-Anchored (PopQA)**:
- Orange dashed line
- Starts at ~50% accuracy
- Dips to ~30% at Layer 5
- Recovers to ~55% by Layer 15
- Confidence interval: ±4%
- **Q-Anchored (TriviaQA)**:
- Green solid line
- Starts at ~70%
- Drops to ~50% at Layer 5
- Peaks at ~85% by Layer 15
- Confidence interval: ±6%
- **A-Anchored (TriviaQA)**:
- Red dashed line
- Starts at ~40%
- Dips to ~25% at Layer 5
- Recovers to ~50% by Layer 15
- Confidence interval: ±5%
- **Q-Anchored (HotpotQA)**:
- Purple solid line
- Starts at ~60%
- Drops to ~40% at Layer 5
- Peaks at ~75% by Layer 15
- Confidence interval: ±7%
- **A-Anchored (HotpotQA)**:
- Gray dashed line
- Starts at ~35%
- Dips to ~20% at Layer 5
- Recovers to ~45% by Layer 15
- Confidence interval: ±6%
- **Q-Anchored (NQ)**:
- Pink solid line
- Starts at ~80%
- Drops to ~60% at Layer 5
- Peaks at ~90% by Layer 15
- Confidence interval: ±8%
- **A-Anchored (NQ)**:
- Black dashed line
- Starts at ~55%
- Dips to ~40% at Layer 5
- Recovers to ~65% by Layer 15
- Confidence interval: ±7%
#### Llama-3.2-3B (Right Chart)
- **Q-Anchored (PopQA)**:
- Blue solid line
- Starts at ~85%
- Drops to ~60% at Layer 10
- Peaks at ~95% by Layer 25
- Confidence interval: ±4%
- **A-Anchored (PopQA)**:
- Orange dashed line
- Starts at ~55%
- Dips to ~40% at Layer 10
- Recovers to ~65% by Layer 25
- Confidence interval: ±5%
- **Q-Anchored (TriviaQA)**:
- Green solid line
- Starts at ~75%
- Drops to ~55% at Layer 10
- Peaks at ~90% by Layer 25
- Confidence interval: ±5%
- **A-Anchored (TriviaQA)**:
- Red dashed line
- Starts at ~45%
- Dips to ~30% at Layer 10
- Recovers to ~60% by Layer 25
- Confidence interval: ±6%
- **Q-Anchored (HotpotQA)**:
- Purple solid line
- Starts at ~65%
- Drops to ~45% at Layer 10
- Peaks at ~85% by Layer 25
- Confidence interval: ±6%
- **A-Anchored (HotpotQA)**:
- Gray dashed line
- Starts at ~30%
- Dips to ~20% at Layer 10
- Recovers to ~50% by Layer 25
- Confidence interval: ±7%
- **Q-Anchored (NQ)**:
- Pink solid line
- Starts at ~85%
- Drops to ~65% at Layer 10
- Peaks at ~95% by Layer 25
- Confidence interval: ±7%
- **A-Anchored (NQ)**:
- Black dashed line
- Starts at ~60%
- Dips to ~45% at Layer 10
- Recovers to ~75% by Layer 25
- Confidence interval: ±8%
### Key Observations
1. **Model Size Impact**:
- 3B model shows more stable performance at deeper layers (Layer 25) compared to 1B model
- 1B model exhibits sharper accuracy drops in early layers (Layer 5)
2. **Q vs A Anchoring**:
- Q-Anchored methods consistently outperform A-Anchored across all datasets
- Performance gap widens in deeper layers (Layer 15–25)
3. **Dataset Variability**:
- NQ shows highest baseline accuracy (80–95%)
- HotpotQA exhibits largest confidence intervals (±6–8%)
4. **Layer Depth Trends**:
- All methods show U-shaped curves (initial drop, mid-layer recovery, final peak)
- 3B model maintains higher accuracy in later layers (Layer 20–25)
### Interpretation
The data suggests that Q-Anchored methods (question-focused anchoring) outperform A-Anchored methods (answer-focused anchoring) across all datasets and model sizes. The 3B model demonstrates better layer-wise stability, maintaining higher accuracy in deeper layers compared to the 1B variant. The U-shaped performance curves indicate that early layers struggle with context integration, while deeper layers achieve better reasoning capabilities. The largest performance gaps appear in complex datasets like HotpotQA, suggesting that question anchoring is particularly critical for multi-hop reasoning tasks. The confidence intervals highlight significant variability in model performance, especially in the 1B model, which may reflect limited capacity to handle diverse question types.