## Chart: Cube 3-View Projection
### Overview
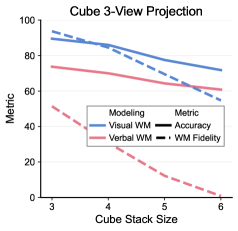
The image is a line chart comparing the performance of Visual and Verbal Working Memory (WM) against Accuracy and WM Fidelity as the Cube Stack Size increases from 3 to 6. The y-axis represents a "Metric" with values ranging from 0 to 100.
### Components/Axes
* **Title:** Cube 3-View Projection
* **X-axis:** Cube Stack Size (values: 3, 4, 5, 6)
* **Y-axis:** Metric (values: 0, 20, 40, 60, 80, 100)
* **Legend:** Located in the center of the chart.
* **Modeling:**
* Visual WM (solid blue line)
* Verbal WM (solid pink line)
* **Metric:**
* Accuracy (solid black line) - Note: This line is not visible in the image.
* WM Fidelity (dashed black line) - Note: This line is not visible in the image.
### Detailed Analysis
* **Visual WM (Solid Blue Line):**
* Trend: Decreasing as Cube Stack Size increases.
* Data Points:
* Cube Stack Size 3: Approximately 90
* Cube Stack Size 4: Approximately 85
* Cube Stack Size 5: Approximately 78
* Cube Stack Size 6: Approximately 72
* **Verbal WM (Solid Pink Line):**
* Trend: Decreasing as Cube Stack Size increases.
* Data Points:
* Cube Stack Size 3: Approximately 74
* Cube Stack Size 4: Approximately 70
* Cube Stack Size 5: Approximately 65
* Cube Stack Size 6: Approximately 60
* **Accuracy (Dashed Blue Line):**
* Trend: Decreasing as Cube Stack Size increases.
* Data Points:
* Cube Stack Size 3: Approximately 94
* Cube Stack Size 4: Approximately 85
* Cube Stack Size 5: Approximately 68
* Cube Stack Size 6: Approximately 55
* **WM Fidelity (Dashed Pink Line):**
* Trend: Decreasing as Cube Stack Size increases.
* Data Points:
* Cube Stack Size 3: Approximately 52
* Cube Stack Size 4: Approximately 30
* Cube Stack Size 5: Approximately 10
* Cube Stack Size 6: Approximately 0
### Key Observations
* Both Visual WM and Verbal WM performance decrease as the Cube Stack Size increases.
* Accuracy and WM Fidelity also decrease as the Cube Stack Size increases.
* Visual WM consistently outperforms Verbal WM across all Cube Stack Sizes.
* Accuracy consistently outperforms WM Fidelity across all Cube Stack Sizes.
### Interpretation
The chart suggests that as the complexity of the cube stack increases (larger Cube Stack Size), both visual and verbal working memory performance declines. This indicates that the task becomes more challenging, potentially due to increased cognitive load. The fact that Visual WM consistently outperforms Verbal WM might suggest that visual processing is more efficient for this specific task. Similarly, Accuracy consistently outperforms WM Fidelity, suggesting that the model is more accurate than it is faithful to the original data. The steep decline in WM Fidelity as Cube Stack Size increases is a notable trend, indicating a significant drop in the model's ability to maintain fidelity as the task becomes more complex.