\n
## Line Chart: Cube 3-View Projection
### Overview
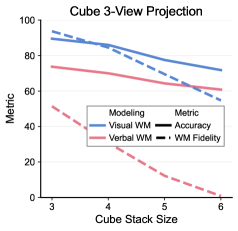
This image presents a line chart illustrating the relationship between "Cube Stack Size" and various "Metric" values, specifically related to "Modeling" types: "Visual WM" and "Verbal WM". The chart displays trends for "Accuracy" and "WM Fidelity" as well. The x-axis represents "Cube Stack Size" ranging from 3 to 6, while the y-axis represents "Metric" ranging from 0 to 100.
### Components/Axes
* **Title:** Cube 3-View Projection
* **X-axis:** Cube Stack Size (3, 4, 5, 6)
* **Y-axis:** Metric (0 to 100)
* **Legend:** Located in the top-right corner.
* **Modeling:**
* Visual WM (Solid Blue Line)
* Verbal WM (Solid Red Line)
* **Metric:**
* Accuracy (Solid Black Line)
* WM Fidelity (Dashed Black Line)
### Detailed Analysis
The chart contains four distinct lines, each representing a different metric.
* **Visual WM (Blue):** This line starts at approximately 92 at a Cube Stack Size of 3 and slopes downward, reaching approximately 75 at a Cube Stack Size of 6. The trend is consistently downward, but the slope appears to decrease as the Cube Stack Size increases.
* **Verbal WM (Red):** This line begins at approximately 45 at a Cube Stack Size of 3 and exhibits a steep downward slope, reaching approximately 5 at a Cube Stack Size of 6. The decline is more pronounced than that of Visual WM.
* **Accuracy (Black):** This line starts at approximately 85 at a Cube Stack Size of 3 and decreases to approximately 60 at a Cube Stack Size of 6. The slope is moderate and relatively consistent.
* **WM Fidelity (Dashed Black):** This line begins at approximately 65 at a Cube Stack Size of 3 and decreases to approximately 40 at a Cube Stack Size of 6. The slope is moderate and relatively consistent.
### Key Observations
* All metrics demonstrate a negative correlation with Cube Stack Size – as the Cube Stack Size increases, the metric values generally decrease.
* Verbal WM exhibits the most significant decline with increasing Cube Stack Size.
* Visual WM shows the least decline, maintaining a relatively higher value across the range of Cube Stack Sizes.
* Accuracy and WM Fidelity show similar trends, with moderate declines.
### Interpretation
The data suggests that increasing the complexity of the cube stack (as measured by Cube Stack Size) negatively impacts performance on tasks related to both visual and verbal working memory, as well as accuracy and WM fidelity. The steeper decline in Verbal WM indicates that verbal working memory is more sensitive to increased complexity than visual working memory. This could imply that the task relies more heavily on verbal processing, or that the verbal component is more easily disrupted by increased cognitive load. The consistent downward trends across all metrics suggest a general effect of complexity on cognitive performance. The differences in the slopes of the lines suggest varying degrees of sensitivity to complexity among the different metrics. This data could be used to inform the design of tasks or interfaces to minimize cognitive load and optimize performance. The chart provides quantitative evidence of the trade-off between complexity and performance in a 3-view cube projection task.