\n
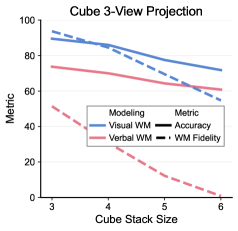
## Line Chart: Cube 3-View Projection
### Overview
The image displays a line chart titled "Cube 3-View Projection." It plots the performance of two modeling approaches (Visual WM and Verbal WM) across two metrics (Accuracy and WM Fidelity) as a function of increasing "Cube Stack Size." The chart shows a general downward trend for all plotted series as the stack size increases.
### Components/Axes
* **Chart Title:** "Cube 3-View Projection" (centered at the top).
* **X-Axis:**
* **Label:** "Cube Stack Size"
* **Markers/Ticks:** 3, 4, 5, 6
* **Y-Axis:**
* **Label:** "Metric"
* **Scale:** 0 to 100, with major gridlines at intervals of 20 (0, 20, 40, 60, 80, 100).
* **Legend:** Positioned in the top-right quadrant of the chart area. It is organized into two columns:
* **Column Header (Modeling):** Lists the two model types.
* `Visual WM` (associated with a solid blue line)
* `Verbal WM` (associated with a solid red/pink line)
* **Column Header (Metric):** Lists the two metrics.
* `Accuracy` (associated with a solid line style)
* `WM Fidelity` (associated with a dashed line style)
* **Line Identification:** The legend creates four distinct series by combining color and line style:
1. **Visual WM - Accuracy:** Solid blue line.
2. **Verbal WM - Accuracy:** Solid red/pink line.
3. **Visual WM - WM Fidelity:** Dashed blue line.
4. **Verbal WM - WM Fidelity:** Dashed red/pink line.
### Detailed Analysis
**Trend Verification & Data Points (Approximate):**
All four lines exhibit a negative slope, indicating a decline in metric values as Cube Stack Size increases from 3 to 6.
1. **Visual WM - Accuracy (Solid Blue Line):**
* **Trend:** Slopes downward steadily.
* **Points:**
* Stack Size 3: ~95
* Stack Size 4: ~88
* Stack Size 5: ~80
* Stack Size 6: ~72
2. **Verbal WM - Accuracy (Solid Red/Pink Line):**
* **Trend:** Slopes downward, with a slightly shallower initial slope than the Visual WM Accuracy line.
* **Points:**
* Stack Size 3: ~75
* Stack Size 4: ~70
* Stack Size 5: ~65
* Stack Size 6: ~60
3. **Visual WM - WM Fidelity (Dashed Blue Line):**
* **Trend:** Slopes downward, closely mirroring the path of the Visual WM Accuracy line but consistently positioned below it.
* **Points:**
* Stack Size 3: ~90
* Stack Size 4: ~82
* Stack Size 5: ~72
* Stack Size 6: ~62
4. **Verbal WM - WM Fidelity (Dashed Red/Pink Line):**
* **Trend:** Slopes downward most steeply of all series, especially between stack sizes 4 and 6.
* **Points:**
* Stack Size 3: ~52
* Stack Size 4: ~38
* Stack Size 5: ~20
* Stack Size 6: ~5
### Key Observations
1. **Universal Decline:** Performance on all metrics degrades as the cognitive load (Cube Stack Size) increases.
2. **Model Performance Gap:** The Visual WM model consistently outperforms the Verbal WM model on both Accuracy and WM Fidelity metrics at every stack size.
3. **Metric Gap:** For both models, the "WM Fidelity" score is lower than the "Accuracy" score at the same stack size. This gap is relatively consistent for the Visual WM model but widens dramatically for the Verbal WM model.
4. **Diverging Fidelity:** The most striking trend is the precipitous drop in Verbal WM - WM Fidelity, which falls from ~52 to near zero, suggesting a near-total collapse of fidelity for the verbal model at higher stack sizes.
5. **Crossover Point:** The Verbal WM - Accuracy line (solid red) remains above the Visual WM - WM Fidelity line (dashed blue) until approximately stack size 5, after which the dashed blue line is higher.
### Interpretation
The chart demonstrates a clear negative relationship between task complexity (represented by Cube Stack Size) and system performance. The data suggests that the "Visual WM" modeling approach is more robust to increasing complexity than the "Verbal WM" approach, maintaining higher scores across the board.
The critical insight lies in the relationship between "Accuracy" and "WM Fidelity." While both decline, the catastrophic drop in Verbal WM Fidelity indicates that even when the verbal model's output might be superficially "accurate" (scoring ~60 at size 6), its internal representation or fidelity to the working memory task has severely degraded (scoring ~5). This implies a potential decoupling between output correctness and internal process integrity under high load for the verbal system. In contrast, the visual model's fidelity degrades in closer concert with its accuracy, suggesting a more stable internal process. This has significant implications for system design, indicating that visual-based working memory models may scale better for complex, multi-element tasks.