## Line Chart: Cube 3-View Projection
### Overview
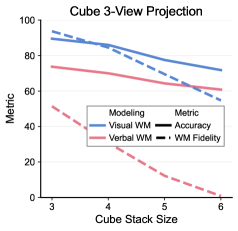
The chart illustrates the relationship between "Cube Stack Size" (x-axis) and a "Metric" (y-axis) for two distinct data series: "Visual WM" (blue solid line) and "Verbal WM" (red dashed line). The y-axis ranges from 0 to 100, while the x-axis spans cube stack sizes from 3 to 6. The legend is positioned in the top-right corner, categorizing the data under "Modeling" and "Metric."
### Components/Axes
- **Title**: "Cube 3-View Projection"
- **X-axis**: "Cube Stack Size" (values: 3, 4, 5, 6)
- **Y-axis**: "Metric" (values: 0, 20, 40, 60, 80, 100)
- **Legend**:
- **Modeling**:
- "Visual WM" (blue solid line)
- **Metric**:
- "Accuracy" (black solid line, not visible in the chart)
- "WM Fidelity" (dashed black line, not visible in the chart)
- **Verbal WM** (red dashed line, labeled under "Metric" in the legend)
### Detailed Analysis
- **Visual WM (Blue Solid Line)**:
- Starts at approximately **90** when cube stack size is 3.
- Decreases gradually to **~70** at cube stack size 6.
- Trend: **Downward slope** with minimal fluctuation.
- **Verbal WM (Red Dashed Line)**:
- Starts at approximately **50** when cube stack size is 3.
- Drops sharply to **~5** at cube stack size 6.
- Trend: **Steep downward slope** with a near-linear decline.
### Key Observations
1. **Inverse Relationship**: Both "Visual WM" and "Verbal WM" metrics decrease as cube stack size increases.
2. **Divergence in Decline**: "Verbal WM" exhibits a significantly steeper decline compared to "Visual WM."
3. **Legend Discrepancy**: The legend lists "Accuracy" and "WM Fidelity" under "Metric," but these are not represented in the chart. Only "Visual WM" and "Verbal WM" are plotted.
### Interpretation
The chart suggests that increasing cube stack size negatively impacts both "Visual WM" and "Verbal WM" metrics. However, "Verbal WM" is disproportionately affected, dropping from 50 to near 0 as stack size grows. This could imply that verbal working memory is more sensitive to cognitive load or complexity in this context. The legend's inclusion of "Accuracy" and "WM Fidelity" under "Metric" may indicate a broader framework, but their absence in the chart raises questions about data completeness or labeling errors. The spatial grounding of the legend (top-right) and the clear color coding (blue for "Visual WM," red for "Verbal WM") ensure accurate interpretation despite potential ambiguities in the legend's structure.