## Bar Chart: Evaluation Metrics Across Information Sources
### Overview
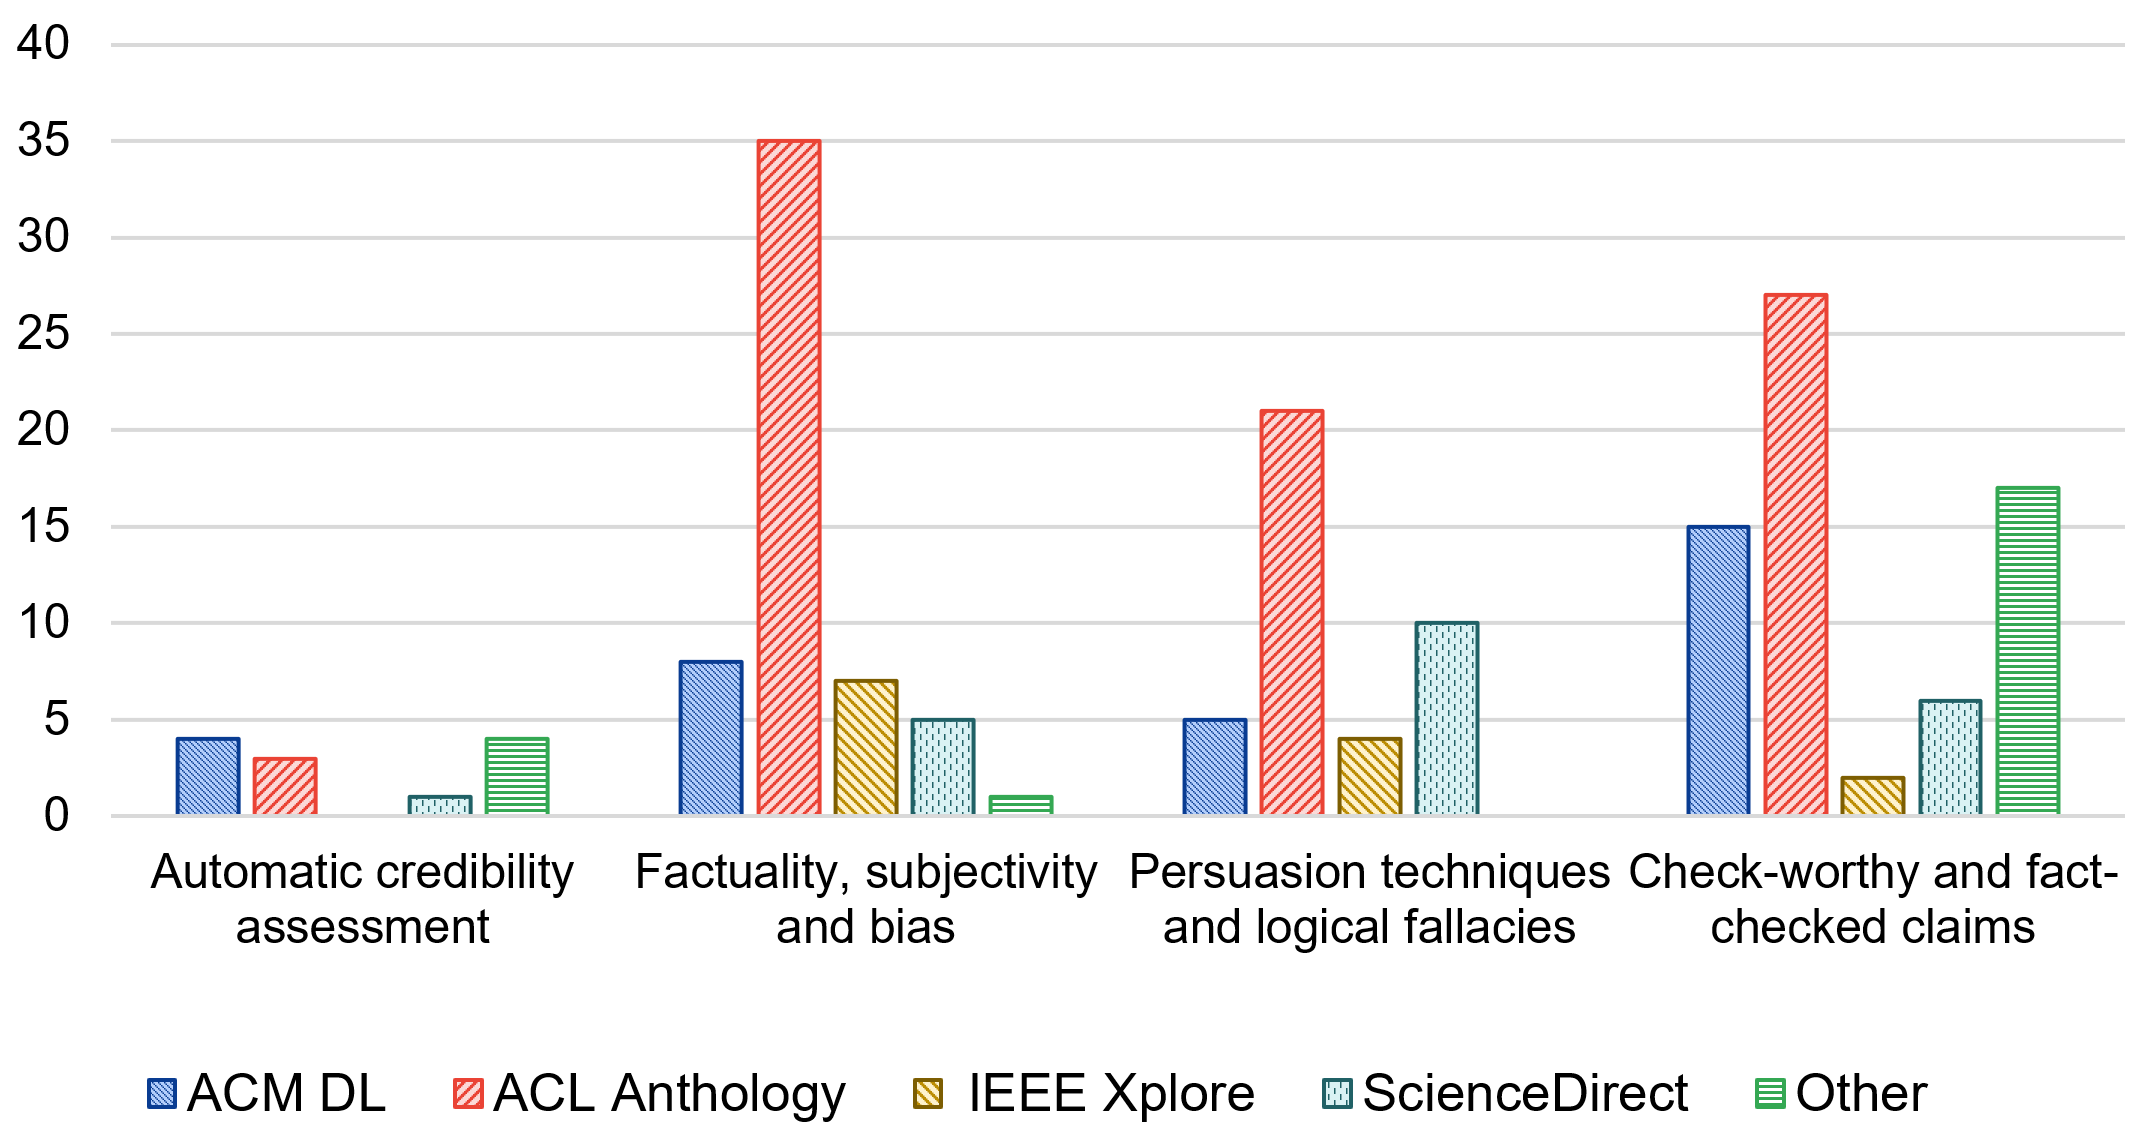
The chart compares five information sources (ACM DL, ACL Anthology, IEEE Xplore, ScienceDirect, and Other) across four evaluation categories: Automatic credibility assessment, Factuality/subjectivity/bias, Persuasion techniques/logical fallacies, and Check-worthy/fact-checked claims. Values are represented by colored bars with distinct patterns.
### Components/Axes
- **X-axis**: Categories of evaluation metrics (Automatic credibility assessment, Factuality/subjectivity/bias, Persuasion techniques/logical fallacies, Check-worthy/fact-checked claims)
- **Y-axis**: Numerical scale from 0 to 40 (no explicit unit provided)
- **Legend**: Located at the bottom, mapping colors/patterns to sources:
- Blue (solid): ACM DL
- Red (diagonal stripes): ACL Anthology
- Yellow (diagonal stripes): IEEE Xplore
- Teal (dotted): ScienceDirect
- Green (horizontal stripes): Other
### Detailed Analysis
1. **Automatic credibility assessment** (leftmost category):
- Red (ACL Anthology): ~3
- Blue (ACM DL): ~4
- Green (Other): ~4
- Yellow (IEEE Xplore): Not visible (value = 0)
- Teal (ScienceDirect): ~1
2. **Factuality/subjectivity/bias** (second category):
- Red (ACL Anthology): ~35 (tallest bar)
- Blue (ACM DL): ~8
- Yellow (IEEE Xplore): ~7
- Teal (ScienceDirect): ~5
- Green (Other): ~1
3. **Persuasion techniques/logical fallacies** (third category):
- Teal (ScienceDirect): ~10 (tallest bar)
- Red (ACL Anthology): ~21
- Yellow (IEEE Xplore): ~4
- Blue (ACM DL): ~5
- Green (Other): Not visible (value = 0)
4. **Check-worthy/fact-checked claims** (rightmost category):
- Red (ACL Anthology): ~27
- Blue (ACM DL): ~15
- Green (Other): ~17
- Teal (ScienceDirect): ~6
- Yellow (IEEE Xplore): ~2
### Key Observations
- **Dominance of ACL Anthology**: Red bars (ACL Anthology) are the tallest in two categories (Factuality/subjectivity/bias and Check-worthy claims), suggesting strong emphasis on these metrics.
- **ACM DL's Focus**: Blue bars (ACM DL) peak in Check-worthy claims (~15), indicating prioritization of fact-checked content.
- **ScienceDirect's Specialization**: Teal bars (ScienceDirect) dominate Persuasion techniques (~10), highlighting its focus on this metric.
- **IEEE Xplore's Weakness**: Yellow bars (IEEE Xplore) are minimal in Automatic credibility assessment and Persuasion techniques, with moderate presence in other categories.
- **Other's Contribution**: Green bars (Other) are most prominent in Check-worthy claims (~17), suggesting diverse sources contribute here.
### Interpretation
The data reveals distinct priorities among information sources:
1. **ACL Anthology** emphasizes factual accuracy and fact-checked claims, potentially reflecting its role in academic publishing.
2. **ACM DL** shows balanced evaluation but excels in fact-checked content, aligning with its focus on computer science literature.
3. **ScienceDirect** specializes in evaluating persuasion techniques, possibly due to its medical/scientific publishing scope.
4. **IEEE Xplore** demonstrates weaker performance in credibility and persuasion metrics, which may indicate different editorial standards or content focus.
5. The "Other" category's strong showing in fact-checked claims suggests a diverse ecosystem of sources contributing to this metric.
The chart highlights how different academic and professional information sources prioritize various aspects of credibility and content quality, with potential implications for research methodology and information verification practices.