## Charts: Lift and Drag Coefficients vs. Angle of Attack
### Overview
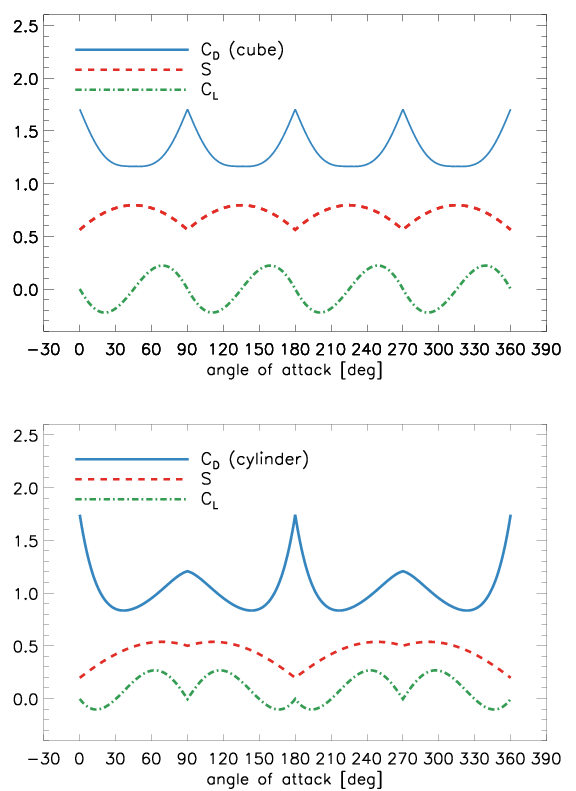
The image presents two charts, stacked vertically. Both charts depict the relationship between the angle of attack (in degrees) and the lift coefficient (Cl) and drag coefficient (Cd) for two different shapes: a cube and a cylinder. The charts use line graphs to represent the data.
### Components/Axes
Both charts share the same axes:
* **X-axis:** Angle of Attack [deg], ranging from -30 to 390 degrees, with markings every 30 degrees.
* **Y-axis:** Coefficient values, ranging from 0 to 2.5.
* **Legend (Top-Right of each chart):**
* Blue Solid Line: Cd (cube) / Cd (cylinder) - Drag Coefficient
* Red Dashed Line: Cs (cube) / Cs (cylinder) - (likely a typo, should be Cd)
* Green Dotted Line: Cl - Lift Coefficient
### Detailed Analysis or Content Details
**Chart 1: Cube**
* **Cd (Blue Line):** The drag coefficient for the cube exhibits a generally undulating pattern. It starts at approximately 1.9 at -30 degrees, decreases to a minimum of around 1.2 at 30 degrees, increases to a maximum of approximately 2.1 at 120 degrees, then decreases again, oscillating between approximately 1.2 and 2.1 throughout the range.
* **Cs (Red Line):** (Assuming this is Cd) The drag coefficient for the cube exhibits a generally undulating pattern. It starts at approximately 0.6 at -30 degrees, increases to a maximum of around 0.8 at 30 degrees, decreases to a minimum of approximately 0.3 at 120 degrees, then increases again, oscillating between approximately 0.3 and 0.8 throughout the range.
* **Cl (Green Line):** The lift coefficient for the cube starts at approximately 0.0 at -30 degrees, increases to a maximum of around 0.4 at 90 degrees, decreases to a minimum of approximately -0.2 at 270 degrees, and oscillates around 0.0 throughout the range.
**Chart 2: Cylinder**
* **Cd (Blue Line):** The drag coefficient for the cylinder exhibits a similar undulating pattern to the cube, but with different values. It starts at approximately 1.7 at -30 degrees, decreases to a minimum of around 0.8 at 30 degrees, increases to a maximum of approximately 2.2 at 120 degrees, then decreases again, oscillating between approximately 0.8 and 2.2 throughout the range.
* **Cs (Red Line):** (Assuming this is Cd) The drag coefficient for the cylinder exhibits a generally undulating pattern. It starts at approximately 0.4 at -30 degrees, increases to a maximum of around 0.6 at 30 degrees, decreases to a minimum of approximately 0.2 at 120 degrees, then increases again, oscillating between approximately 0.2 and 0.6 throughout the range.
* **Cl (Green Line):** The lift coefficient for the cylinder starts at approximately 0.0 at -30 degrees, increases to a maximum of around 1.6 at 90 degrees, decreases to a minimum of approximately -1.2 at 270 degrees, and oscillates around 0.0 throughout the range.
### Key Observations
* The cylinder generally exhibits a higher maximum lift coefficient (Cl) than the cube.
* The drag coefficient (Cd) for both shapes fluctuates significantly with the angle of attack.
* The lift coefficient (Cl) for both shapes is zero at angles of attack of -30 and 360 degrees.
* The cylinder has a lower drag coefficient than the cube across most angles of attack.
* There appears to be a typo in the legend, where "Cs" is likely intended to be "Cd".
### Interpretation
The charts demonstrate how the aerodynamic forces (lift and drag) acting on a cube and a cylinder change as the angle of attack varies. The oscillating behavior of both Cl and Cd is due to the changing pressure distribution around the shapes as the angle of attack increases. The cylinder, with its more streamlined shape, experiences lower drag and higher lift compared to the cube, especially at higher angles of attack. This is consistent with aerodynamic principles, where streamlined shapes reduce flow separation and thus reduce drag. The data suggests that the cylinder is a more efficient shape for generating lift while minimizing drag compared to the cube. The cyclical nature of the curves indicates that the aerodynamic performance repeats itself as the angle of attack completes a full rotation. The differences in the magnitude of the oscillations between the cube and the cylinder highlight the impact of shape on aerodynamic behavior.