## Aerodynamic Coefficient Charts: Cube vs. Cylinder
### Overview
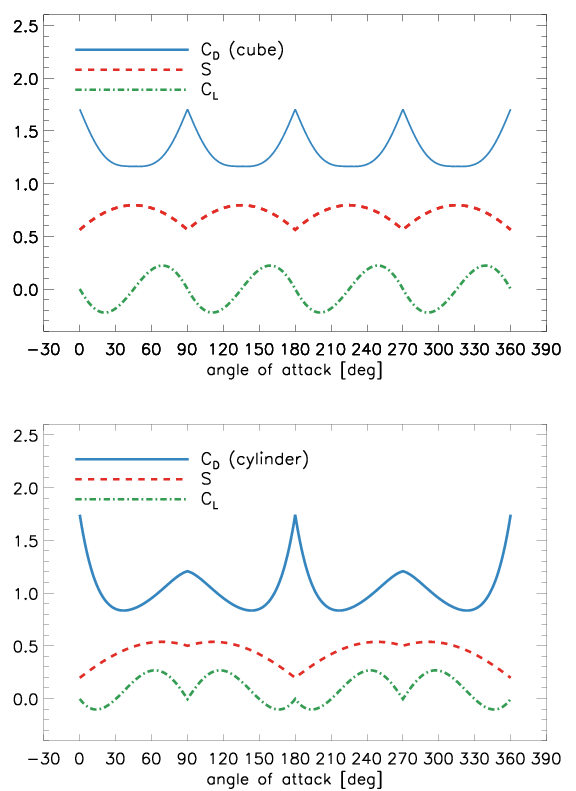
The image contains two vertically stacked line charts comparing the aerodynamic coefficients of a cube and a cylinder as a function of the angle of attack. Both charts share the same x-axis and y-axis scales and legend structure, allowing for direct comparison. The data appears to be from a computational or experimental study of bluff body aerodynamics.
### Components/Axes
* **Chart Type:** Two 2D line plots.
* **X-Axis (Both Charts):** Label: `angle of attack [deg]`. Scale: Linear, from -30 to 390 degrees. Major tick marks are every 30 degrees (0, 30, 60, ..., 360).
* **Y-Axis (Both Charts):** Unlabeled, but represents the magnitude of the coefficients. Scale: Linear, from 0.0 to 2.5. Major tick marks are every 0.5 units (0.0, 0.5, 1.0, 1.5, 2.0, 2.5).
* **Legend (Both Charts):** Located in the top-left corner of each plot area.
* **Top Chart (Cube):**
* `C_D (cube)`: Solid blue line. Represents the drag coefficient for the cube.
* `S`: Dashed red line. Likely represents a side force coefficient or a related parameter.
* `C_L`: Dash-dot green line. Represents the lift coefficient.
* **Bottom Chart (Cylinder):**
* `C_D (cylinder)`: Solid blue line. Represents the drag coefficient for the cylinder.
* `S`: Dashed red line. Same parameter as in the top chart.
* `C_L`: Dash-dot green line. Same parameter as in the top chart.
### Detailed Analysis
**Top Chart: Cube Aerodynamics**
* **C_D (cube) - Blue Solid Line:** Exhibits a strong, periodic pattern with sharp peaks and broad minima. Peaks occur at approximately 0°, 90°, 180°, 270°, and 360°, with a value of ~1.7. Minima occur at approximately 45°, 135°, 225°, and 315°, with a value of ~1.2. The trend is perfectly symmetric about 180°.
* **S - Red Dashed Line:** Shows a smoother, sinusoidal oscillation. Peaks at ~0.8 occur near 45°, 135°, 225°, and 315°. Minima at ~0.5 occur near 0°, 90°, 180°, 270°, and 360°. This pattern is 45° out of phase with the C_D peaks.
* **C_L - Green Dash-Dot Line:** Also shows a sinusoidal oscillation, centered around 0. Peaks at ~0.2 occur near 60°, 150°, 240°, and 330°. Minima at ~-0.2 occur near 30°, 120°, 210°, and 300°. The pattern is symmetric about the x-axis.
**Bottom Chart: Cylinder Aerodynamics**
* **C_D (cylinder) - Blue Solid Line:** Shows a more complex periodic pattern. It features very sharp, high peaks at 0°, 180°, and 360°, reaching ~1.7. There are secondary, broader peaks at 90° and 270°, reaching ~1.2. Deep minima occur at approximately 45°, 135°, 225°, and 315°, with a value of ~0.8. The pattern is symmetric about 180°.
* **S - Red Dashed Line:** Exhibits a smooth oscillation. Peaks at ~0.55 occur near 90° and 270°. Minima at ~0.2 occur near 0°, 180°, and 360°. The amplitude is smaller than for the cube.
* **C_L - Green Dash-Dot Line:** Shows a complex oscillation. It has peaks at ~0.25 near 60°, 120°, 240°, and 300°. It has minima at ~-0.1 near 30°, 150°, 210°, and 330°. The pattern is symmetric about the x-axis but has a different shape compared to the cube's C_L.
### Key Observations
1. **Fundamental Periodicity:** Both shapes show aerodynamic coefficients that are periodic with the angle of attack, repeating every 90° for the cube and every 180° for the cylinder, reflecting their geometric symmetries.
2. **Drag Coefficient (C_D) Behavior:** The cube's drag is highest when a flat face is perpendicular to the flow (0°, 90°, etc.) and lowest when a corner is presented (45°, 135°, etc.). The cylinder's drag is highest at 0° and 180° (broadside) and has a secondary maximum at 90° and 270°.
3. **Phase Relationships:** For the cube, the peaks in `S` and the minima in `C_D` are aligned (e.g., at 45°). For the cylinder, the peaks in `S` align with the secondary peaks in `C_D` (at 90° and 270°).
4. **Lift Coefficient (C_L) Symmetry:** The C_L for both shapes oscillates symmetrically around zero, indicating no net lift over a full rotation, as expected for symmetric bodies.
### Interpretation
These charts illustrate the fundamental differences in flow separation and pressure distribution between a sharp-edged bluff body (cube) and a smooth, curved bluff body (cylinder).
* **Cube:** The sharp corners fix the flow separation points. The drag is maximized when the projected frontal area is largest (flat face to flow) and minimized when the flow can more smoothly navigate around a leading corner. The `S` coefficient likely represents a side force that peaks when the flow asymmetry is greatest (at 45° angles).
* **Cylinder:** The smooth surface allows the separation point to move with the angle of attack, leading to a more complex drag curve. The very sharp drag peaks at 0° and 180° suggest a sudden change in the wake structure, possibly related to the onset of vortex shedding or a transition in the separation pattern. The secondary peaks at 90°/270° correspond to the orientation where the cylinder's curvature presents the most abrupt change to the oncoming flow.
**Notable Anomaly:** The most striking feature is the extremely sharp, narrow peak in the cylinder's C_D at exactly 180°. This suggests a highly sensitive, possibly unstable, flow condition at that precise orientation, which could be an important design consideration for structures subject to wind loads. The data implies that small changes in angle near 180° for a cylinder result in large changes in drag force.