# Technical Document Extraction: Aerodynamic Coefficients vs. Angle of Attack
## Image Description
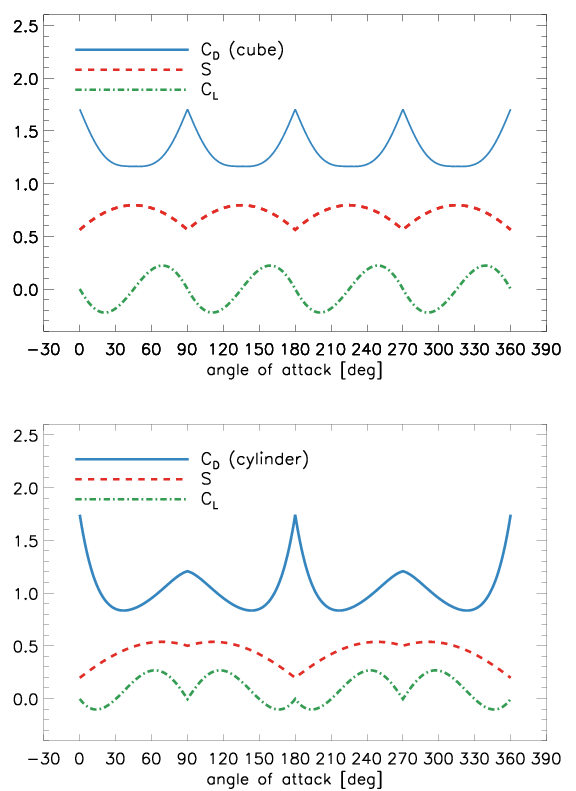
The image contains two line graphs comparing aerodynamic coefficients (C_d, S, C_L) for a **cube** and a **cylinder** across varying angles of attack (AoA). Each graph includes three data series represented by distinct line styles and colors, with legends positioned on the right side of each plot.
---
## Graph 1: Cube Aerodynamics
### Components
- **Title**: "C_d (cube)" (top of the graph)
- **X-axis**: "angle of attack [deg]" ranging from -30° to 390°
- **Y-axis**: Coefficient values (unitless, 0.0 to 2.5)
- **Legend**:
- **Blue solid line**: C_d (cube)
- **Red dashed line**: S (cube)
- **Green dotted line**: C_L (cube)
### Key Trends
1. **C_d (cube)**:
- **Trend**: Sinusoidal pattern with peaks at 180° and 360°, minima at 0°, 90°, 270°, and 390°.
- **Data Points**:
- Peaks: ~2.2 at 180°, ~2.2 at 360°
- Minima: ~1.0 at 0°, ~1.0 at 90°, ~1.0 at 270°, ~1.0 at 390°
2. **S (cube)**:
- **Trend**: Periodic with peaks at 90° and 270°, minima at 0°, 180°, 360°, and 390°.
- **Data Points**:
- Peaks: ~0.6 at 90°, ~0.6 at 270°
- Minima: ~0.4 at 0°, ~0.4 at 180°, ~0.4 at 360°, ~0.4 at 390°
3. **C_L (cube)**:
- **Trend**: Periodic with peaks at 90° and 270°, minima at 0°, 180°, 360°, and 390°.
- **Data Points**:
- Peaks: ~0.3 at 90°, ~0.3 at 270°
- Minima: ~-0.1 at 0°, ~-0.1 at 180°, ~-0.1 at 360°, ~-0.1 at 390°
---
## Graph 2: Cylinder Aerodynamics
### Components
- **Title**: "C_d (cylinder)" (top of the graph)
- **X-axis**: "angle of attack [deg]" ranging from -30° to 390°
- **Y-axis**: Coefficient values (unitless, 0.0 to 2.5)
- **Legend**:
- **Blue solid line**: C_d (cylinder)
- **Red dashed line**: S (cylinder)
- **Green dotted line**: C_L (cylinder)
### Key Trends
1. **C_d (cylinder)**:
- **Trend**: Sharp peaks at 0°, 180°, and 360°, with troughs at 90°, 270°, and 390°.
- **Data Points**:
- Peaks: ~2.5 at 0°, ~2.5 at 180°, ~2.5 at 360°
- Minima: ~1.0 at 90°, ~1.0 at 270°, ~1.0 at 390°
2. **S (cylinder)**:
- **Trend**: Similar to the cube but with slightly reduced amplitude.
- **Data Points**:
- Peaks: ~0.5 at 90°, ~0.5 at 270°
- Minima: ~0.3 at 0°, ~0.3 at 180°, ~0.3 at 360°, ~0.3 at 390°
3. **C_L (cylinder)**:
- **Trend**: Matches the cube’s pattern but with lower magnitude.
- **Data Points**:
- Peaks: ~0.2 at 90°, ~0.2 at 270°
- Minima: ~-0.05 at 0°, ~-0.05 at 180°, ~-0.05 at 360°, ~-0.05 at 390°
---
## Cross-Reference Validation
- **Legend Colors**:
- Blue (solid) consistently represents C_d for both shapes.
- Red (dashed) represents S for both shapes.
- Green (dotted) represents C_L for both shapes.
- **Spatial Grounding**: Legends are positioned on the right side of each graph, aligned with their respective data series.
---
## Observations
1. **C_d Behavior**:
- The cube exhibits a sinusoidal C_d pattern, while the cylinder shows sharper, more pronounced peaks at 0°, 180°, and 360°.
- Both shapes reach similar maximum C_d values (~2.2–2.5).
2. **S Parameter**:
- Peaks at 90° and 270° for both shapes, indicating symmetry in side force generation.
3. **C_L Behavior**:
- Both shapes show periodic lift variations, with the cylinder’s C_L being less pronounced than the cube’s.
---
## Conclusion
The graphs highlight distinct aerodynamic behaviors between a cube and a cylinder. The cube’s C_d follows a sinusoidal pattern, while the cylinder’s C_d exhibits sharp peaks at specific angles. The S and C_L parameters show similar periodic trends for both shapes but with differing magnitudes.