## Diagram: Directed Graph with Nodes and Edges
### Overview
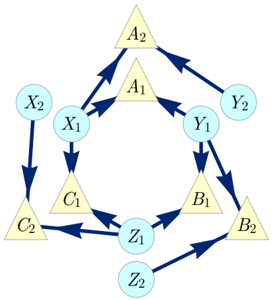
The image displays a directed graph, also known as a directed network or a digraph. It consists of nodes, represented by circles and triangles, and directed edges, indicated by arrows connecting these nodes. The graph appears to represent relationships or flows between different entities.
### Components/Axes
There are no explicit axes or legends in this diagram. The components are the nodes and the directed edges.
**Nodes:**
* **Circular Nodes (Light Blue):**
* X1
* X2
* Y1
* Y2
* Z1
* Z2
* **Triangular Nodes (Yellow):**
* A1
* A2
* B1
* B2
* C1
* C2
**Edges:**
The edges are represented by dark blue arrows, indicating the direction of the relationship or flow from one node to another.
### Detailed Analysis or Content Details
The diagram shows the following directed connections:
* **From X1:**
* To A1
* To C1
* **From X2:**
* To C2
* **From Y1:**
* To A1
* To B1
* **From Y2:**
* To A2
* **From Z1:**
* To C1
* To B2
* **From Z2:**
* To B2
* **From A1:**
* To A2
* **From A2:**
* To A1
* **From B1:**
* To A1
* **From B2:**
* To B1
* **From C1:**
* To C2
* **From C2:**
* To C1
There are also connections that appear to form cycles:
* A1 <-> A2 (bidirectional connection)
* C1 <-> C2 (bidirectional connection)
* B2 -> B1 -> A1 -> A2 -> A1 (part of a larger cycle involving B1, A1, A2)
### Key Observations
* The graph contains distinct sets of nodes, differentiated by shape and color (light blue circles and yellow triangles).
* There are several bidirectional relationships, forming cycles between pairs of nodes (A1-A2, C1-C2).
* The nodes X1, X2, Y1, Y2, Z1, and Z2 appear to be source nodes for some relationships, as they have outgoing edges but no incoming edges shown from other nodes within the diagram. However, they do receive input from other nodes in the diagram.
* The nodes A1, A2, B1, B2, C1, and C2 are involved in more complex interconnections and cycles.
### Interpretation
This directed graph likely represents a system with various interacting components. The circular nodes (X, Y, Z) might represent input sources or initial states, while the triangular nodes (A, B, C) could represent intermediate states, processes, or entities that are influenced by the circular nodes and also interact with each other.
The presence of bidirectional edges (cycles) between A1-A2 and C1-C2 suggests feedback loops or reciprocal relationships within these pairs. For instance, A1 influences A2, and A2 also influences A1. Similarly for C1 and C2.
The overall structure suggests a flow of influence or information. For example, X1 influences both A1 and C1. Y1 influences A1 and B1. Z1 influences C1 and B2. This indicates that multiple inputs can converge on certain nodes. The triangular nodes also exhibit a hierarchical or sequential flow, such as C1 leading to C2, and B2 leading to B1.
The diagram could be modeling a biological pathway, a network of dependencies, a state transition diagram, or a causal relationship model. Without further context, the exact meaning of the nodes and edges remains speculative, but the visual representation clearly outlines the directed relationships and potential feedback mechanisms within the system. The arrangement of nodes in a roughly hexagonal pattern with central connections might imply a cyclical or modular structure.