\n
## Diagram: Cyclic Process Flow
### Overview
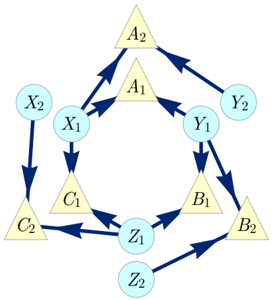
The image depicts a cyclic process flow diagram with eight nodes, some represented as circles and others as triangles, connected by directed arrows. The nodes are labeled X1, X2, Y1, Y2, Z1, Z2, C1, C2, A1, A2, and B1, B2. The diagram suggests a series of transformations or dependencies between these elements.
### Components/Axes
The diagram consists of the following components:
* **Nodes:**
* Circles: X1, X2, Y1, Y2, Z1, Z2
* Triangles: A1, A2, B1, B2, C1, C2
* **Arrows:** Directed arrows indicating the flow of the process.
* **Labels:** Each node is labeled with a unique identifier (X1, X2, etc.).
### Detailed Analysis or Content Details
The diagram shows the following flow:
1. X2 -> X1 -> C1
2. C1 -> Z1 -> Z2
3. Z2 -> B1 -> B2
4. B2 -> Y1 -> Y2
5. Y2 -> A1 -> A2
6. A2 -> X1
The diagram forms a closed loop, indicating a cyclical process. The flow can be traced as follows:
* X2 feeds into X1.
* X1 feeds into C1.
* C1 feeds into Z1.
* Z1 feeds into Z2.
* Z2 feeds into B1.
* B1 feeds into B2.
* B2 feeds into Y1.
* Y1 feeds into Y2.
* Y2 feeds into A1.
* A1 feeds into A2.
* A2 feeds back into X1, completing the cycle.
### Key Observations
The diagram is a closed loop, suggesting a continuous process. The alternating arrangement of circles and triangles might indicate different types of elements or stages within the process. The flow is unidirectional, meaning the process moves in a specific direction.
### Interpretation
This diagram likely represents a system with feedback loops. The cyclical nature suggests that the output of one stage influences the input of another, creating a self-regulating or iterative process. The alternating shapes could represent different types of components or processes. For example, circles might represent states or variables, while triangles represent transformations or operations. The diagram could be a simplified model of a complex system, such as a chemical reaction, a control system, or a biological pathway. Without additional context, the specific meaning of the nodes and arrows remains ambiguous, but the diagram clearly illustrates a cyclical relationship between the elements. The diagram is a visual representation of a system where each element influences the next in a continuous loop. The arrangement of circles and triangles may indicate different types of elements or stages within the process.