## Diagram: Network Flowchart with Interconnected Components
### Overview
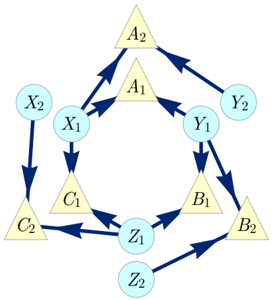
The image depicts a directed graph (flowchart) illustrating relationships and flows between labeled nodes. Nodes are color-coded: yellow triangles (A1, A2, B1, B2, C1, C2) and blue circles (X1, X2, Y1, Y2, Z1, Z2). Arrows indicate bidirectional or unidirectional connections, forming cycles and hierarchical relationships.
### Components/Axes
- **Nodes**:
- **Yellow Triangles** (A1, A2, B1, B2, C1, C2): Likely represent primary components or categories.
- **Blue Circles** (X1, X2, Y1, Y2, Z1, Z2): Likely represent secondary or intermediary nodes.
- **Arrows**:
- **Dark Blue Arrows**: Indicate directional relationships (e.g., A1 → X1, X1 → A1).
- **Bidirectional Arrows**: Suggest mutual dependencies (e.g., A1 ↔ X1, Y1 ↔ B1).
### Detailed Analysis
1. **Central Cycle**:
- A1 ↔ X1 ↔ C1 ↔ Z1 ↔ B1 ↔ Y1 ↔ A1 forms a central loop, indicating a core interdependent system.
2. **Peripheral Loops**:
- A2 ↔ Y2, B2 ↔ Z2, and C2 ↔ X2 form smaller, isolated loops, suggesting modular subsystems.
3. **Directional Flow**:
- Arrows from A1 to X1/Y1/A2 and vice versa imply bidirectional interactions.
- Arrows from B1 to Y1/Z1 and vice versa reinforce mutual dependencies.
- Arrows from C1 to X1/Z1 and vice versa highlight cross-connections.
### Key Observations
- **Hub Nodes**: X1, Y1, Z1 act as central hubs, connecting multiple nodes and cycles.
- **Modularity**: Subsystems (A2-Y2, B2-Z2, C2-X2) operate independently but are linked to the central cycle.
- **Redundancy**: Bidirectional arrows suggest feedback loops or redundancy in the system.
### Interpretation
The diagram represents a complex, interconnected system with modular subsystems and central hubs. The central cycle (A1-X1-C1-Z1-B1-Y1-A1) likely represents a core process with mutual dependencies, while peripheral loops (A2-Y2, B2-Z2, C2-X2) may denote self-sustaining or isolated components. The bidirectional arrows emphasize reciprocal relationships, suggesting feedback mechanisms or equilibrium states. This structure could model organizational workflows, data flow in a network, or interdependent processes in a technical system. The absence of numerical values implies the focus is on relational dynamics rather than quantitative metrics.