## Scatter Plot with Regression Lines and Density Plots: Domain Adaptation
### Overview
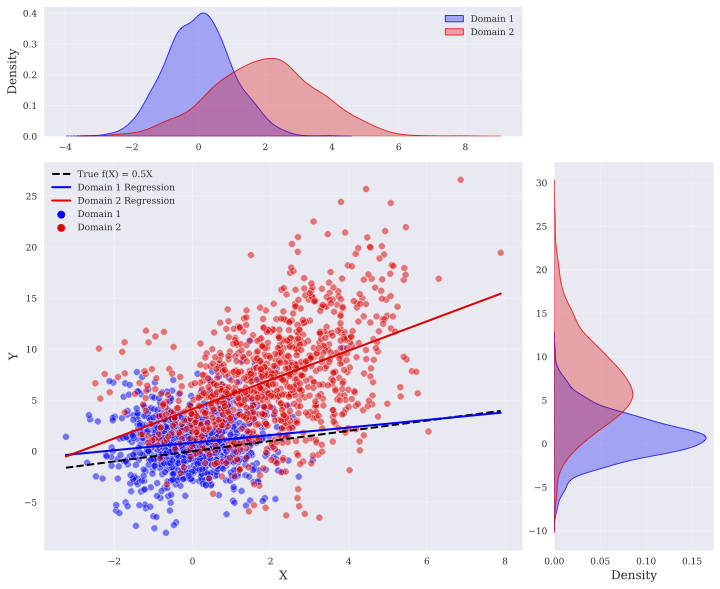
The image presents a scatter plot visualizing two datasets ("Domain 1" and "Domain 2") with their respective linear regression lines. Superimposed on the scatter plot are density plots showing the distribution of each domain along the x-axis, and a marginal density plot along the y-axis. A dashed black line represents the "True f(x) = 0.5X" function, serving as a ground truth for comparison. The plot appears to demonstrate a domain adaptation scenario, where a model trained on one domain (Domain 1) is attempting to generalize to another (Domain 2).
### Components/Axes
* **X-axis:** Labeled "X", ranging approximately from -3 to 8.
* **Y-axis:** Labeled "Y", ranging approximately from -10 to 30.
* **Density Plots:** Two density plots are positioned at the top of the image, representing the distribution of Domain 1 (blue) and Domain 2 (red) along the X-axis. A marginal density plot is positioned on the right side of the image, representing the distribution of both domains along the Y-axis.
* **Legend:** Located in the top-right corner, with the following entries:
* "Domain 1" (Blue)
* "Domain 2" (Red)
* "True f(x) = 0.5X" (Black dashed line)
* "Domain 1 Regression" (Blue line)
* "Domain 2 Regression" (Red line)
### Detailed Analysis
**Scatter Plot Data:**
* **Domain 1 (Blue):** Approximately 100 data points are scattered, primarily clustered around the line of regression. The points are distributed roughly between X = -2 and X = 3, and Y = -5 to 5.
* **Domain 2 (Red):** Approximately 100 data points are scattered, also clustered around its regression line. The points are distributed roughly between X = 2 and X = 8, and Y = 5 to 25.
**Regression Lines:**
* **Domain 1 Regression (Blue):** The blue regression line has a positive slope, but is relatively shallow. It starts around Y = -1 when X = -2, and reaches approximately Y = 3 when X = 3.
* **Domain 2 Regression (Red):** The red regression line has a steeper positive slope than the blue line. It starts around Y = 5 when X = 2, and reaches approximately Y = 20 when X = 8.
* **True f(x) = 0.5X (Black Dashed):** This line has a moderate positive slope. It passes through the origin (0,0) and appears to be a reference for the expected relationship between X and Y.
**Density Plots:**
* **Domain 1 (Blue):** The density plot is centered around X = 0, with a peak density around X = 0.5. It extends from approximately X = -2 to X = 2.
* **Domain 2 (Red):** The density plot is centered around X = 4, with a peak density around X = 4. It extends from approximately X = 2 to X = 8.
* **Y-axis Density Plot:** The density plot is bimodal, with peaks around Y = 0 and Y = 10.
### Key Observations
* The two domains have different distributions along the X-axis, as evidenced by the separate density plots.
* The regression lines for each domain differ in slope, indicating different relationships between X and Y in each domain.
* The Domain 2 regression line is steeper than the Domain 1 regression line.
* The "True f(x) = 0.5X" line falls between the two regression lines, closer to the Domain 1 regression line.
* There is a clear separation between the data points of Domain 1 and Domain 2 in the scatter plot.
### Interpretation
This visualization likely demonstrates a domain adaptation problem in regression. The "True f(x) = 0.5X" represents the underlying relationship between X and Y. Domain 1 appears to be more closely aligned with this true function, while Domain 2 exhibits a different relationship. The differing regression lines suggest that a model trained on Domain 1 would not generalize well to Domain 2, and vice versa. The density plots highlight the distributional shift between the two domains, which is a common challenge in domain adaptation. The bimodal distribution on the Y-axis suggests a potential confounding factor or a more complex relationship between X and Y than a simple linear model can capture. The plot illustrates the need for techniques to mitigate the effects of domain shift and improve generalization performance.