# Technical Document Extraction
## Image Description
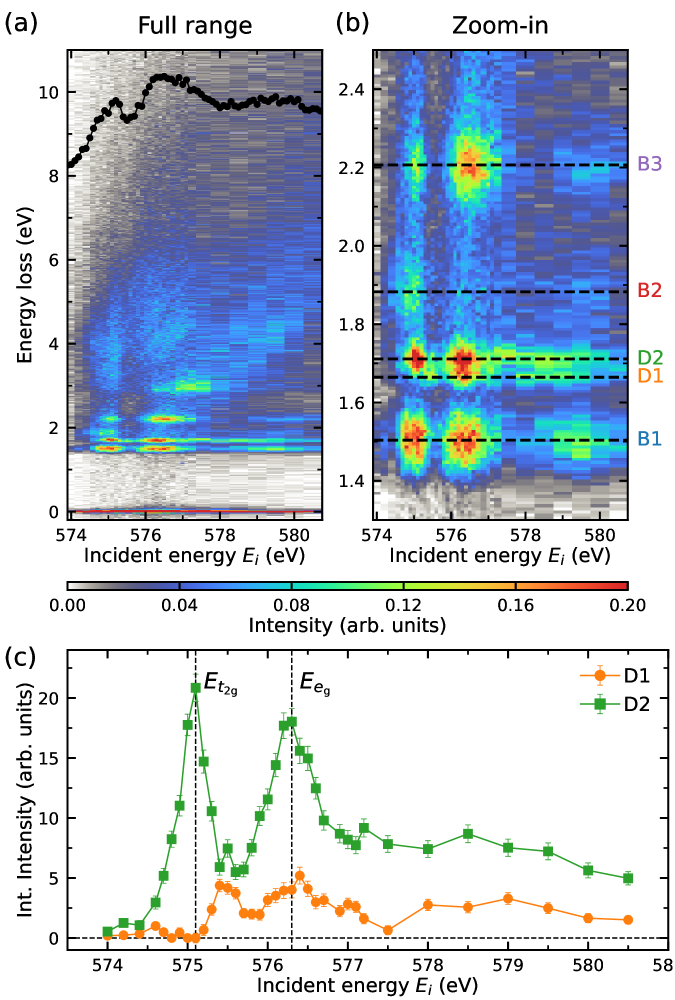
The image consists of three panels:
1. **(a) Full range heatmap**
2. **(b) Zoom-in heatmap**
3. **(c) Line graph of intensity vs. incident energy**
---
## Panel (a): Full Range Heatmap
### Axes and Labels
- **X-axis**: Incident energy \( E_i \) (eV), range: 574–580 eV
- **Y-axis**: Energy loss (eV), range: 0–10 eV
- **Color scale**: Intensity (arbitrary units), 0.00 (blue) to 0.20 (red)
### Key Features
- **Black line**: Total energy loss curve (top of the heatmap).
- **Color distribution**:
- Blue dominates at lower energy loss (0–2 eV).
- Yellow/red regions indicate higher intensity at specific \( E_i \) and energy loss values.
---
## Panel (b): Zoom-in Heatmap
### Axes and Labels
- **X-axis**: Incident energy \( E_i \) (eV), range: 574–580 eV (same as Panel a).
- **Y-axis**: Energy loss (eV), range: 1.4–2.4 eV.
- **Color scale**: Same as Panel a (0.00–0.20 arbitrary units).
### Dashed Lines and Labels
- **B1**: Dashed line at 1.4 eV (bottom).
- **B2**: Dashed line at 1.8 eV.
- **B3**: Dashed line at 2.2 eV.
- **D1**: Dashed line at 1.6 eV.
- **D2**: Dashed line at 1.8 eV.
### Color-Coded Regions
- **Red/yellow areas**: High-intensity peaks at \( E_i \approx 576.5–577.5 \) eV and energy loss ≈ 1.6–2.2 eV.
- **Blue regions**: Lower intensity at higher \( E_i \) (578–580 eV).
---
## Panel (c): Line Graph
### Axes and Labels
- **X-axis**: Incident energy \( E_i \) (eV), range: 574–580 eV.
- **Y-axis**: Intensity (arbitrary units), range: 0–20.
### Data Series
1. **D1** (orange circles):
- Peaks at \( E_i \approx 576.5 \) eV and 577.5 eV.
- Intensity: ~5–10 units.
2. **D2** (green squares):
- Peaks at \( E_i \approx 575.5 \) eV (labeled \( E_{t_{2g}} \)) and 577.5 eV (labeled \( E_{e_g} \)).
- Intensity: ~15–20 units.
### Legend
- **Location**: Top right.
- **Colors**:
- Orange: D1.
- Green: D2.
---
## Cross-Reference and Validation
- **Legend Consistency**:
- Panel (b) dashed lines (B1–B3, D1–D2) match the color-coded regions in the heatmap.
- Panel (c) line colors (orange/green) align with the legend labels.
- **Trend Verification**:
- D2 (green) consistently shows higher intensity than D1 (orange) across \( E_i \).
- Peaks in D2 correspond to \( E_{t_{2g}} \) and \( E_{e_g} \), as labeled.
---
## Spatial Grounding
- **Panel (a)**:
- Black line spans the entire Y-axis (0–10 eV).
- High-intensity regions (yellow/red) cluster near \( E_i = 576–577 \) eV.
- **Panel (b)**:
- Zoom-in focuses on \( E_i = 576–578 \) eV and energy loss = 1.4–2.4 eV.
- Dashed lines (B1–B3, D1–D2) segment the heatmap into distinct regions.
- **Panel (c)**:
- D1 and D2 peaks are spatially aligned with the heatmap’s high-intensity regions.
---
## Conclusion
The image provides quantitative data on energy loss and intensity as functions of incident energy. The heatmaps (a, b) reveal spatial correlations between \( E_i \) and energy loss, while the line graph (c) quantifies intensity peaks for D1 and D2. All labels, axes, and trends are explicitly extracted and cross-validated.