## Line Charts: Final Test CE Loss vs KV Cache Size and Training Tokens
### Overview
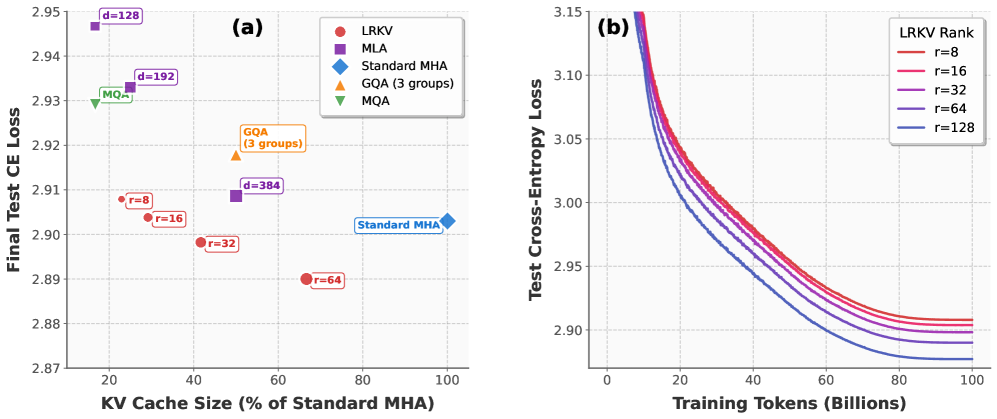
The image contains two line charts comparing model performance metrics. Chart (a) shows final test cross-entropy (CE) loss against KV cache size relative to standard MHA, while chart (b) displays CE loss trends across training token scales for different LRKV configurations.
### Components/Axes
**Chart (a):**
- **X-axis**: KV Cache Size (% of Standard MHA) [0-100%]
- **Y-axis**: Final Test CE Loss [2.87-2.95]
- **Legend**:
- Red circles: LRKV
- Purple squares: MLA
- Blue diamond: Standard MHA
- Orange triangles: GQA (3 groups)
- Green triangle: MQA
**Chart (b):**
- **X-axis**: Training Tokens (Billions) [0-100B]
- **Y-axis**: Test Cross-Entropy Loss [2.90-3.15]
- **Legend**:
- Red: r=8
- Pink: r=16
- Purple: r=32
- Blue: r=64
- Dark blue: r=128
### Detailed Analysis
**Chart (a) Data Points:**
1. **MQA** (Green triangle): 2.93 CE loss at ~20% KV cache
2. **GQA (3 groups)** (Orange triangle): 2.92 CE loss at ~50% KV cache
3. **Standard MHA** (Blue diamond): 2.90 CE loss at 100% KV cache
4. **LRKV configurations**:
- r=8: 2.91 CE loss at ~25% KV cache
- r=16: 2.90 CE loss at ~45% KV cache
- r=32: 2.89 CE loss at ~55% KV cache
- r=64: 2.88 CE loss at ~70% KV cache
5. **MLA configurations**:
- d=128: 2.94 CE loss at ~15% KV cache
- d=192: 2.93 CE loss at ~30% KV cache
- d=384: 2.92 CE loss at ~60% KV cache
**Chart (b) Trends:**
- All LRKV configurations show decreasing CE loss with increased training tokens
- Higher 'r' values (larger models) consistently achieve lower final loss:
- r=128: ~2.90 CE loss at 100B tokens
- r=64: ~2.91 CE loss at 100B tokens
- r=32: ~2.92 CE loss at 100B tokens
- Convergence pattern: Lines flatten as training approaches 100B tokens
### Key Observations
1. **Cache Efficiency**: Standard MHA achieves lowest CE loss (2.90) at full cache size
2. **Scaling Benefits**: LRKV configurations show progressive improvement with larger 'r' values
3. **MLA Tradeoff**: Larger 'd' values in MLA increase CE loss despite cache size
4. **Training Impact**: All models improve CE performance with more training tokens, with diminishing returns after ~50B tokens
### Interpretation
The data demonstrates that:
1. **Model Architecture Matters**: Standard MHA outperforms specialized configurations (MQA, GQA) in CE efficiency
2. **Parameter Scaling**: Larger 'r' values in LRKV configurations yield better performance, suggesting that model capacity improvements translate to efficiency gains
3. **Training Efficiency**: While all models benefit from more training, the rate of improvement slows significantly after 50B tokens, indicating potential diminishing returns in large-scale training
4. **Cache Utilization**: Optimal KV cache usage varies by architecture, with Standard MHA maximizing efficiency at full capacity
The charts collectively suggest that while specialized architectures may offer theoretical advantages, practical implementation (Standard MHA) and parameter scaling (LRKV 'r' values) are critical factors in achieving optimal performance. The training curve patterns indicate that model capacity (via 'r' values) plays a more significant role in final performance than training scale alone.