\n
## Line Chart: Accuracy on I_r & I_t (%) vs. # Iterations
### Overview
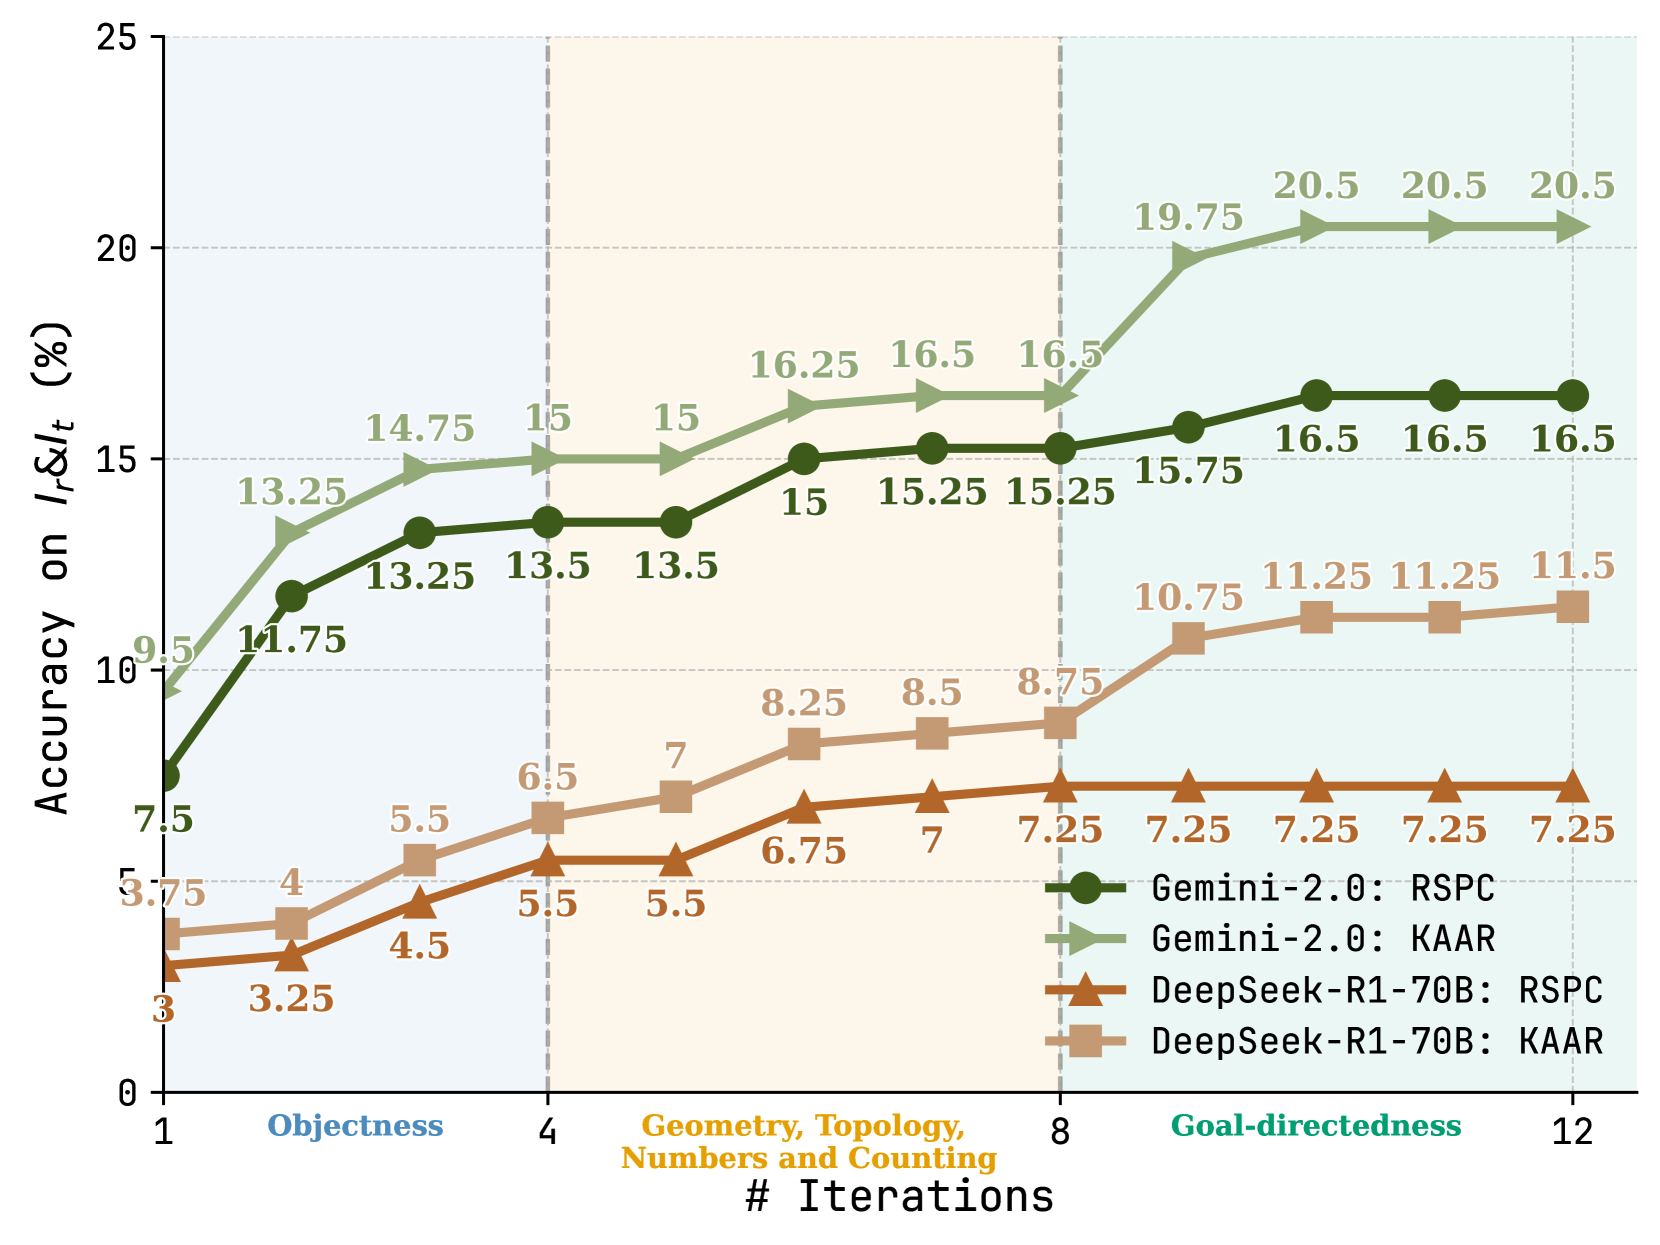
This is a line chart comparing the performance of two AI models (Gemini-2.0 and DeepSeek-R1-70B) using two different methods (RSPC and KAAR) across a series of iterations. The chart tracks accuracy percentage on a metric labeled "I_r & I_t" over 12 iterations, which are grouped into three distinct cognitive task phases.
### Components/Axes
* **Y-Axis:** Labeled "Accuracy on I_r & I_t (%)". Scale ranges from 0 to 25, with major gridlines at intervals of 5.
* **X-Axis:** Labeled "# Iterations". Scale ranges from 1 to 12. The axis is segmented into three phases, indicated by background shading and labels:
* **Phase 1 (Iterations 1-4):** "Objectness" (light blue background).
* **Phase 2 (Iterations 4-8):** "Geometry, Topology, Numbers and Counting" (light beige background).
* **Phase 3 (Iterations 8-12):** "Goal-directedness" (light cyan background).
* **Legend:** Located in the bottom-right quadrant of the chart area. It defines four data series:
1. **Gemini-2.0: RSPC** - Dark green line with circle markers.
2. **Gemini-2.0: KAAR** - Light green line with right-pointing triangle markers.
3. **DeepSeek-R1-70B: RSPC** - Dark orange/brown line with upward-pointing triangle markers.
4. **DeepSeek-R1-70B: KAAR** - Light orange/tan line with square markers.
### Detailed Analysis
**Data Series and Trends:**
1. **Gemini-2.0: KAAR (Light Green, Right Triangles)**
* **Trend:** Shows the strongest and most consistent upward trend, plateauing at the highest accuracy level.
* **Data Points:**
* Iteration 1: 9.5%
* Iteration 2: 13.25%
* Iteration 3: 14.75%
* Iteration 4: 15%
* Iteration 5: 15%
* Iteration 6: 16.25%
* Iteration 7: 16.5%
* Iteration 8: 16.5%
* Iteration 9: 19.75%
* Iteration 10: 20.5%
* Iteration 11: 20.5%
* Iteration 12: 20.5%
2. **Gemini-2.0: RSPC (Dark Green, Circles)**
* **Trend:** Shows a steady upward trend, consistently performing below its KAAR counterpart but above both DeepSeek series. It plateaus in the final phase.
* **Data Points:**
* Iteration 1: 7.5%
* Iteration 2: 11.75%
* Iteration 3: 13.25%
* Iteration 4: 13.5%
* Iteration 5: 13.5%
* Iteration 6: 15%
* Iteration 7: 15.25%
* Iteration 8: 15.25%
* Iteration 9: 15.75%
* Iteration 10: 16.5%
* Iteration 11: 16.5%
* Iteration 12: 16.5%
3. **DeepSeek-R1-70B: KAAR (Light Orange, Squares)**
* **Trend:** Shows a moderate upward trend, with a notable jump between iterations 8 and 9. It is the second-highest performing series by the end.
* **Data Points:**
* Iteration 1: 3.75%
* Iteration 2: 4%
* Iteration 3: 5.5%
* Iteration 4: 6.5%
* Iteration 5: 7%
* Iteration 6: 8.25%
* Iteration 7: 8.5%
* Iteration 8: 8.75%
* Iteration 9: 10.75%
* Iteration 10: 11.25%
* Iteration 11: 11.25%
* Iteration 12: 11.5%
4. **DeepSeek-R1-70B: RSPC (Dark Orange, Up Triangles)**
* **Trend:** Shows the lowest overall performance. It increases gradually and then plateaus completely from iteration 8 onward.
* **Data Points:**
* Iteration 1: 3%
* Iteration 2: 3.25%
* Iteration 3: 4.5%
* Iteration 4: 5.5%
* Iteration 5: 5.5%
* Iteration 6: 6.75%
* Iteration 7: 7%
* Iteration 8: 7.25%
* Iteration 9: 7.25%
* Iteration 10: 7.25%
* Iteration 11: 7.25%
* Iteration 12: 7.25%
### Key Observations
1. **Model Hierarchy:** Gemini-2.0 consistently outperforms DeepSeek-R1-70B across all iterations and both methods.
2. **Method Hierarchy:** For both models, the KAAR method yields higher accuracy than the RSPC method. The performance gap between KAAR and RSPC is larger for Gemini-2.0 than for DeepSeek-R1-70B.
3. **Phase Impact:** All series show their most significant gains during the "Objectness" phase (Iterations 1-4). Growth slows in the "Geometry..." phase and largely plateaus during the "Goal-directedness" phase, except for a final jump for Gemini-2.0: KAAR.
4. **Plateau Points:** DeepSeek-R1-70B: RSPC plateaus earliest (Iteration 8). Gemini-2.0: RSPC and DeepSeek-R1-70B: KAAR show minimal gains after Iteration 10. Gemini-2.0: KAAR reaches its peak at Iteration 10 and holds it.
### Interpretation
The chart demonstrates a clear performance hierarchy between the tested models and methods on the "I_r & I_t" accuracy metric. The data suggests that the **Gemini-2.0 model, when using the KAAR method, is the most effective combination** for this task, achieving over 20% accuracy.
The segmentation into cognitive phases reveals that the **"Objectness" phase is where the most rapid learning or adaptation occurs** for all configurations. The subsequent phases ("Geometry..." and "Goal-directedness") appear to be more challenging, leading to diminishing returns in accuracy gains. This could indicate that the models find basic object recognition easier to improve upon than higher-order geometric reasoning or goal-directed planning within this iterative framework.
The consistent superiority of the KAAR method over RSPC for both models implies that the KAAR approach is more effective for optimizing the measured accuracy. The widening gap between Gemini's KAAR and RSPC lines, compared to the narrower gap for DeepSeek, might suggest that the more capable base model (Gemini) benefits more from the advanced method (KAAR).