## Partition Plot: Input Space Partitioning
### Overview
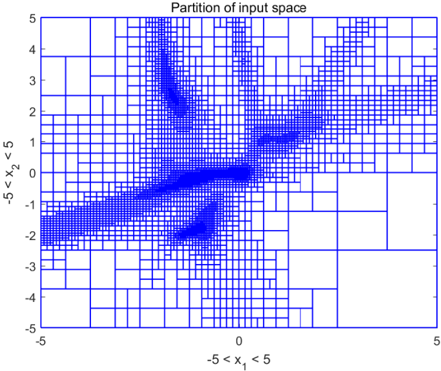
The image is a partition plot visualizing the partitioning of an input space. The space is divided into rectangular regions of varying sizes, with a higher density of smaller regions concentrated in specific areas. The plot is bounded by axes labeled x1 and x2, both ranging from -5 to 5.
### Components/Axes
* **Title:** "Partition of input space"
* **X-axis:** "-5 < x1 < 5" with tick marks at -5, 0, and 5.
* **Y-axis:** "-5 < x2 < 5" with tick marks at -5, -4, -3, -2, -1, 0, 1, 2, 3, 4, and 5.
* **Partitioning:** The space is divided into rectangular cells, with cell size varying across the space. The cells are defined by blue lines.
### Detailed Analysis
The plot shows a rectangular area divided into smaller rectangles. The density of these smaller rectangles is not uniform. There are regions where the rectangles are very small and densely packed, and other regions where the rectangles are larger and more sparse.
* **Dense Regions:** There are three primary regions of high density:
* A region centered approximately at (-2, -2).
* A region centered approximately at (-2, 3).
* A region centered approximately at (1, 1).
* **Sparse Regions:** The regions outside of the dense areas have larger rectangles. The largest rectangles are found in the corners of the plot.
### Key Observations
* The partitioning is adaptive, with finer partitions in regions of interest.
* The regions of interest appear to be clustered around specific coordinates.
* The plot suggests a non-uniform distribution or function being approximated.
### Interpretation
The plot likely represents the result of a space-partitioning algorithm, such as a decision tree or a k-d tree. The dense regions indicate areas where the algorithm has identified significant variations or decision boundaries, requiring finer resolution. The sparse regions indicate areas where the algorithm has determined that coarser resolution is sufficient. The plot visualizes how the input space is divided based on some underlying data or function. The concentration of smaller rectangles suggests that the function being approximated has more complexity in those regions.