\n
## Partition Diagram: Partition of Input Space
### Overview
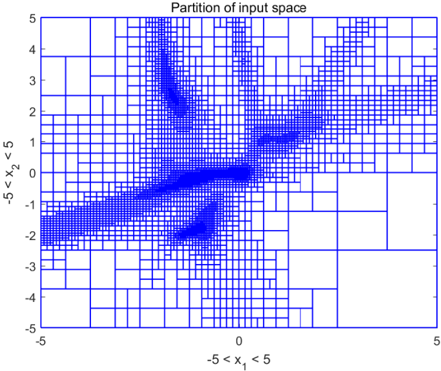
The image depicts a partition of a two-dimensional input space, likely representing the decision boundaries of a classification or regression model. The space is defined by two variables, x₁ and x₂, both ranging from approximately -5 to 5. The partition is visualized as a grid of rectangular regions, with some regions colored blue, indicating a specific classification or value assignment. The density of the blue regions suggests areas of higher concentration or importance.
### Components/Axes
* **Title:** "Partition of input space" (centered at the top)
* **X-axis Label:** "x₁ < 5" (bottom-center)
* **Y-axis Label:** "x₂ < 5" (left-center)
* **X-axis Range:** Approximately -5 to 5
* **Y-axis Range:** Approximately -5 to 5
* **Grid:** A rectangular grid covering the entire space.
* **Colored Regions:** Rectangular regions within the grid, with blue indicating a specific state.
### Detailed Analysis
The diagram shows a partitioning of the space into rectangular regions. The blue regions are not uniformly distributed. They appear to form two distinct, elongated clusters.
* **Cluster 1:** Located in the lower-left quadrant, extending from approximately x₁ = -4 to x₁ = 1 and x₂ = -2.5 to x₂ = 0. This cluster has a higher density of blue regions in the area around x₁ = -2 and x₂ = -1.5.
* **Cluster 2:** Located in the upper-right quadrant, extending from approximately x₁ = 0 to x₁ = 4 and x₂ = 1 to x₂ = 4. This cluster has a higher density of blue regions in the area around x₁ = 2 and x₂ = 2.5.
The remaining regions are not colored blue, suggesting they represent a different classification or value. The grid size appears to be relatively uniform, with rectangles approximately 0.5 x 0.5 units in size. The blue regions are composed of many small squares, indicating a fine-grained partitioning.
### Key Observations
* The blue regions are concentrated in two distinct areas, suggesting two primary classes or value ranges.
* The boundaries between the blue and non-blue regions are not smooth; they follow the grid lines, indicating a discrete partitioning scheme.
* The density of blue regions varies within each cluster, suggesting varying degrees of confidence or importance.
* There is a clear separation between the two clusters, with a relatively large region of non-blue rectangles in the center.
### Interpretation
This diagram likely represents the decision boundaries of a machine learning model, such as a decision tree or a random forest, applied to a two-dimensional dataset. The blue regions represent the areas where the model predicts a specific class or value. The partitioning into rectangular regions suggests that the model makes decisions based on simple thresholds for x₁ and x₂.
The two clusters indicate that the dataset contains two distinct groups of data points. The separation between the clusters suggests that the model is able to effectively discriminate between these groups. The varying density of blue regions within each cluster could indicate that some data points are more confidently classified than others.
The discrete nature of the partitioning suggests that the model may be prone to overfitting or that the input space has been discretized for simplification. The diagram provides a visual representation of the model's decision-making process, allowing for a qualitative assessment of its performance and behavior. The model appears to be sensitive to the values of x₁ and x₂ and makes decisions based on their relative magnitudes.