## Heatmap: Partition of Input Space
### Overview
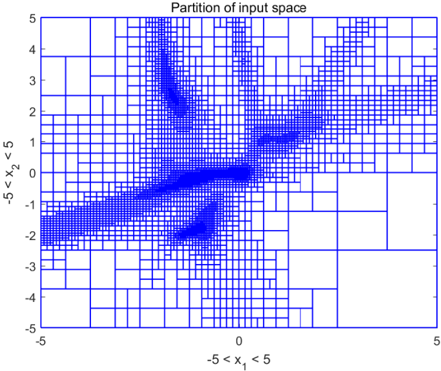
The image depicts a partitioned 2D input space visualized as a grid with varying shades of blue. The grid is divided into irregularly sized rectangles, with darker blue regions indicating higher density or significance. The axes range from -5 to 5 for both x₁ (horizontal) and x₂ (vertical). No explicit legend is present, but color intensity correlates with density.
### Components/Axes
- **X-axis (x₁)**: Labeled "-5 < x₁ < 5", spanning from -5 (left) to 5 (right).
- **Y-axis (x₂)**: Labeled "-5 < x₂ < 5", spanning from -5 (bottom) to 5 (top).
- **Grid Structure**:
- Blue grid lines partition the space into rectangles of varying sizes.
- Rectangles are filled with blue shades, where darker blue indicates higher density.
- **Color Intensity**: No legend, but darker blue regions (e.g., near (-3, -2), (0, 3), (2, 1), and (3, -3)) suggest higher density or importance.
### Detailed Analysis
1. **Dense Regions**:
- **Quadrant III (-3 < x₁ < 0, -3 < x₂ < 0)**: A large dark blue cluster centered near (-3, -2).
- **Quadrant II (-1 < x₁ < 2, 1 < x₂ < 4)**: A diagonal band of medium-to-dark blue stretching from (-1, 1) to (2, 4).
- **Quadrant IV (2 < x₁ < 5, -3 < x₂ < 0)**: A smaller dark blue cluster near (3, -3).
- **Central Band (0 < x₁ < 2, -1 < x₂ < 1)**: A horizontal band of medium blue along the x₁-axis.
2. **Sparse Regions**:
- **Top-Right (x₁ > 3, x₂ > 2)**: Mostly empty with minimal blue shading.
- **Bottom-Left (x₁ < -3, x₂ < -3)**: Sparse shading, except near (-5, -5).
- **Diagonal Line (x₁ = -x₂)**: A faint diagonal boundary from (-5, 5) to (5, -5), separating dense and sparse regions.
3. **Notable Features**:
- **Central Horizontal Band**: Dominates the middle of the plot, suggesting a neutral or transitional zone.
- **Diagonal Asymmetry**: The diagonal line (x₁ = -x₂) acts as a divider, with denser regions below it (Quadrant III and IV) and sparser regions above (Quadrant I and II).
### Key Observations
- **Cluster Distribution**: Dense regions are concentrated in Quadrants III and IV, with secondary clusters in Quadrant II.
- **Central Band**: The horizontal band near the origin may represent a decision boundary or transitional zone.
- **Diagonal Divider**: The line x₁ = -x₂ separates the space into two distinct regions with differing density patterns.
- **Irregular Grid**: The non-uniform rectangle sizes suggest adaptive partitioning, possibly based on data density.
### Interpretation
The heatmap likely represents a decision boundary or clustering result in a 2D input space. The darker blue regions indicate areas of higher density or significance, possibly corresponding to:
- **Data Clusters**: The dense regions may represent clusters of data points or regions where a model makes consistent predictions.
- **Decision Boundaries**: The diagonal line (x₁ = -x₂) and central horizontal band could delineate regions where a classifier or model transitions between states.
- **Adaptive Partitioning**: The irregular grid suggests the space was partitioned based on data distribution, with larger rectangles in sparse areas and smaller ones in dense regions.
The absence of a legend limits quantitative interpretation, but the relative color intensity implies a gradient from low (light blue) to high (dark blue) density. The diagonal asymmetry and central band highlight potential symmetries or biases in the data or model. This visualization could be used to analyze feature interactions, model behavior, or data distribution in a 2D subspace.