## Line Graph: Qwen2.5-3B Performance Analysis
### Overview
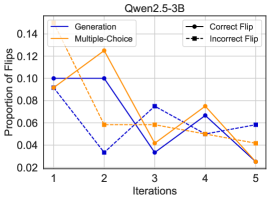
The image is a line graph titled "Qwen2.5-3B," comparing the proportion of flips (correct and incorrect) across iterations for two methods: "Generation" and "Multiple-Choice." The y-axis represents the "Proportion of Flips" (ranging from 0.02 to 0.14), and the x-axis represents "Iterations" (1 to 5). The graph includes a legend distinguishing "Correct Flip" (solid line) and "Incorrect Flip" (dashed line), though the lines are labeled as "Generation" (solid blue) and "Multiple-Choice" (dashed orange).
### Components/Axes
- **Title**: "Qwen2.5-3B"
- **Y-Axis**: "Proportion of Flips" (0.02 to 0.14, increments of 0.02)
- **X-Axis**: "Iterations" (1 to 5, labeled numerically)
- **Legend**:
- "Correct Flip" (solid line, black)
- "Incorrect Flip" (dashed line, black)
- **Data Series**:
- "Generation" (solid blue line)
- "Multiple-Choice" (dashed orange line)
### Detailed Analysis
#### Generation (Solid Blue Line)
- **Iteration 1**: ~0.10
- **Iteration 2**: ~0.03
- **Iteration 3**: ~0.08
- **Iteration 4**: ~0.05
- **Iteration 5**: ~0.06
- **Trend**: The line starts at 0.10, drops sharply to 0.03 at iteration 2, rises to 0.08 at iteration 3, then declines to 0.05 at iteration 4, and slightly increases to 0.06 at iteration 5. The trend shows volatility with no clear upward or downward trajectory.
#### Multiple-Choice (Dashed Orange Line)
- **Iteration 1**: ~0.12
- **Iteration 2**: ~0.14
- **Iteration 3**: ~0.04
- **Iteration 4**: ~0.08
- **Iteration 5**: ~0.04
- **Trend**: The line begins at 0.12, peaks at 0.14 at iteration 2, then drops to 0.04 at iteration 3, rises to 0.08 at iteration 4, and falls to 0.04 at iteration 5. The trend shows a sharp initial increase followed by a decline and partial recovery.
### Key Observations
1. **Generation Method**:
- The proportion of flips (likely correct, as per the solid line) starts at 0.10, dips significantly at iteration 2, and fluctuates thereafter. The lowest point is at iteration 2 (~0.03), suggesting a potential instability or adjustment phase.
2. **Multiple-Choice Method**:
- The proportion of flips (likely incorrect, as per the dashed line) starts at 0.12, peaks at iteration 2 (~0.14), then declines sharply to 0.04 at iteration 3, with a partial recovery to 0.08 at iteration 4 before dropping again. This indicates a high initial error rate that improves over time.
### Interpretation
- **Data Relationships**:
- The "Generation" method (solid blue) shows a more variable performance in terms of flip proportions, with a notable dip at iteration 2. This could reflect challenges in stabilizing the model's output during early iterations.
- The "Multiple-Choice" method (dashed orange) demonstrates a high initial error rate (incorrect flips) that decreases significantly by iteration 3, suggesting improved accuracy or reduced errors over time.
- **Notable Patterns**:
- The "Generation" method's fluctuations might indicate sensitivity to iterative adjustments, while the "Multiple-Choice" method's sharp decline in incorrect flips suggests a more stable or optimized performance after initial iterations.
- **Anomalies**:
- The "Generation" method's sharp drop at iteration 2 (from 0.10 to 0.03) is a significant outlier, potentially indicating a critical adjustment or error in the model's behavior during that phase.
- The "Multiple-Choice" method's peak at iteration 2 (0.14) followed by a steep decline highlights a possible initial misconfiguration or overfitting that was later corrected.
This analysis suggests that the "Multiple-Choice" method may outperform the "Generation" method in terms of stability and error reduction over iterations, though further context (e.g., task specifics, evaluation metrics) would be needed to confirm these trends.