## Chart: Qwen2.5-3B Flips Proportion vs Iterations
### Overview
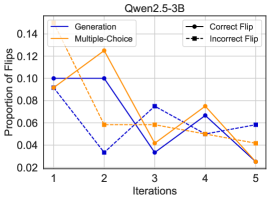
The image is a line chart comparing the proportion of flips across iterations for different methods (Generation vs. Multiple-Choice) and flip correctness (Correct Flip vs. Incorrect Flip). The x-axis represents iterations, and the y-axis represents the proportion of flips.
### Components/Axes
* **Title:** Qwen2.5-3B
* **X-axis:** Iterations (1, 2, 3, 4, 5)
* **Y-axis:** Proportion of Flips (0.02, 0.04, 0.06, 0.08, 0.10, 0.12, 0.14)
* **Legend:** Located in the top-left and top-right corners.
* **Generation:** Solid dark blue line
* **Multiple-Choice:** Solid orange line
* **Correct Flip:** Dashed black line with square markers
* **Incorrect Flip:** Dashed black line with circle markers
### Detailed Analysis
* **Generation (Solid Dark Blue Line):** Starts at approximately 0.10, decreases to approximately 0.03 at iteration 2, increases to approximately 0.03 at iteration 3, increases to approximately 0.07 at iteration 4, and decreases to approximately 0.02 at iteration 5.
* **Multiple-Choice (Solid Orange Line):** Starts at approximately 0.09, increases to approximately 0.12 at iteration 2, decreases to approximately 0.06 at iteration 3, decreases to approximately 0.05 at iteration 4, and decreases to approximately 0.03 at iteration 5.
* **Correct Flip (Dashed Black Line with Square Markers):** Starts at approximately 0.10, decreases to approximately 0.06 at iteration 2, decreases to approximately 0.06 at iteration 3, increases to approximately 0.08 at iteration 4, and decreases to approximately 0.04 at iteration 5.
* **Incorrect Flip (Dashed Black Line with Circle Markers):** Starts at approximately 0.09, decreases to approximately 0.03 at iteration 2, increases to approximately 0.04 at iteration 3, increases to approximately 0.05 at iteration 4, and decreases to approximately 0.02 at iteration 5.
### Key Observations
* The proportion of flips varies across iterations for all methods.
* The Generation method shows a significant drop in the proportion of flips from iteration 1 to iteration 2.
* The Multiple-Choice method shows a peak in the proportion of flips at iteration 2.
* Both Correct Flip and Incorrect Flip methods show a decreasing trend from iteration 1 to iteration 5.
### Interpretation
The chart illustrates how the proportion of flips changes over iterations for different methods (Generation and Multiple-Choice) and flip correctness (Correct and Incorrect). The data suggests that the Generation method is more prone to flips in the initial iterations, while the Multiple-Choice method peaks at iteration 2. The decreasing trend in Correct and Incorrect Flips indicates that the model becomes more stable over iterations. The relationship between the elements shows how different methods and flip types contribute to the overall proportion of flips across iterations. The notable outliers are the peak in Multiple-Choice at iteration 2 and the significant drop in Generation from iteration 1 to iteration 2.