## Line Chart: Proportion of Flips vs. Iterations (Qwen2.5-3B)
### Overview
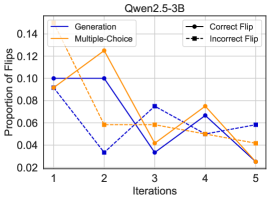
This line chart depicts the proportion of flips across different iterations for various methods: Generation, Multiple-Choice, Correct Flip, and Incorrect Flip. The chart appears to be evaluating the performance of a model (Qwen2.5-3B) over five iterations. The y-axis represents the "Proportion of Flips," ranging from 0.02 to 0.14, while the x-axis represents "Iterations," numbered from 1 to 5.
### Components/Axes
* **Title:** Qwen2.5-3B (top-center)
* **X-axis Label:** Iterations (bottom-center)
* **Y-axis Label:** Proportion of Flips (left-center)
* **Legend:** Located at the top-right of the chart.
* Generation (Solid Blue Line)
* Multiple-Choice (Solid Orange Line)
* Correct Flip (Black Circle-Line)
* Incorrect Flip (Black Dashed-Line)
* **X-axis Markers:** 1, 2, 3, 4, 5
* **Y-axis Markers:** 0.02, 0.04, 0.06, 0.08, 0.10, 0.12, 0.14
### Detailed Analysis
Let's analyze each line individually, noting trends and approximate data points.
* **Generation (Solid Blue Line):** This line starts at approximately 0.09 at Iteration 1, remains relatively stable around 0.10 at Iteration 2, drops to approximately 0.03 at Iteration 3, rises to around 0.05 at Iteration 4, and then decreases to approximately 0.04 at Iteration 5.
* **Multiple-Choice (Solid Orange Line):** This line begins at approximately 0.10 at Iteration 1, peaks at around 0.13 at Iteration 2, declines to approximately 0.06 at Iteration 3, increases to around 0.07 at Iteration 4, and then decreases to approximately 0.06 at Iteration 5.
* **Correct Flip (Black Circle-Line):** This line starts at approximately 0.09 at Iteration 1, drops to around 0.04 at Iteration 2, rises to approximately 0.07 at Iteration 3, decreases to around 0.05 at Iteration 4, and then declines to approximately 0.04 at Iteration 5.
* **Incorrect Flip (Black Dashed-Line):** This line begins at approximately 0.04 at Iteration 1, drops to around 0.03 at Iteration 2, rises to approximately 0.06 at Iteration 3, decreases to around 0.05 at Iteration 4, and then declines to approximately 0.03 at Iteration 5.
### Key Observations
* The "Multiple-Choice" method consistently exhibits the highest proportion of flips, particularly at Iteration 2.
* The "Incorrect Flip" method consistently shows the lowest proportion of flips throughout all iterations.
* The "Generation" and "Correct Flip" methods show similar trends, with fluctuations across iterations.
* All lines generally show a decreasing trend from Iteration 2 to Iteration 5, suggesting a convergence or stabilization of the model's behavior.
### Interpretation
The chart suggests that the "Multiple-Choice" method induces the most changes (flips) in the model's parameters during training, while the "Incorrect Flip" method induces the fewest. This could indicate that the "Multiple-Choice" method is more effective at exploring the parameter space and potentially improving the model's performance. The decreasing trend in all lines over iterations suggests that the model is converging, and the rate of change is slowing down. The Qwen2.5-3B model appears to be stabilizing after the initial iterations. The data suggests that the model is learning and adjusting its parameters, but the rate of adjustment is decreasing over time. The differences in the proportion of flips between the methods could be due to the different ways they influence the model's learning process. Further analysis would be needed to determine the optimal method for training the model and to understand the underlying reasons for the observed trends.