## Line Chart: Qwen2.5-3B Performance Across Iterations
### Overview
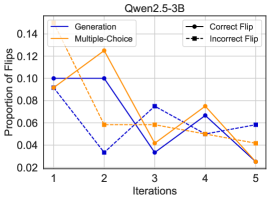
This is a line chart titled "Qwen2.5-3B" that plots the "Proportion of Correct" responses against the number of "Iterations" (from 1 to 5). It compares the performance of four different methods or conditions: Generation, Multiple-Choice, Correct Flip, and Incorrect Flip. The chart shows how the accuracy of each method changes over five sequential iterations.
### Components/Axes
* **Chart Title:** Qwen2.5-3B (located at the top center).
* **X-Axis:** Labeled "Iterations". It has discrete markers at values 1, 2, 3, 4, and 5.
* **Y-Axis:** Labeled "Proportion of Correct". The scale ranges from 0.02 to 0.14, with major tick marks at intervals of 0.02 (0.02, 0.04, 0.06, 0.08, 0.10, 0.12, 0.14).
* **Legend:** Located in the top-right corner of the plot area. It defines four data series:
* **Generation:** Solid blue line with circular markers.
* **Multiple-Choice:** Solid orange line with circular markers.
* **Correct Flip:** Dashed blue line with circular markers.
* **Incorrect Flip:** Dashed orange line with circular markers.
### Detailed Analysis
The following data points are approximate values extracted from the chart. The trend for each series is described first, followed by the estimated values per iteration.
1. **Generation (Solid Blue Line):**
* **Trend:** Starts high, experiences a sharp drop at iteration 2, then shows a partial recovery and fluctuation.
* **Data Points (Approximate):**
* Iteration 1: 0.10
* Iteration 2: 0.03
* Iteration 3: 0.07
* Iteration 4: 0.07
* Iteration 5: 0.06
2. **Multiple-Choice (Solid Orange Line):**
* **Trend:** Starts moderately high, dips at iteration 2, rises to a peak at iteration 4, then declines sharply.
* **Data Points (Approximate):**
* Iteration 1: 0.09
* Iteration 2: 0.06
* Iteration 3: 0.06
* Iteration 4: 0.08
* Iteration 5: 0.02
3. **Correct Flip (Dashed Blue Line):**
* **Trend:** Starts at a similar level to Generation, drops significantly at iteration 2, then shows a steady upward trend.
* **Data Points (Approximate):**
* Iteration 1: 0.09
* Iteration 2: 0.03
* Iteration 3: 0.05
* Iteration 4: 0.05
* Iteration 5: 0.06
4. **Incorrect Flip (Dashed Orange Line):**
* **Trend:** Starts at the same point as Multiple-Choice and Correct Flip, drops at iteration 2, then fluctuates with a slight downward trend overall.
* **Data Points (Approximate):**
* Iteration 1: 0.09
* Iteration 2: 0.06
* Iteration 3: 0.04
* Iteration 4: 0.05
* Iteration 5: 0.05
### Key Observations
* **Universal Dip at Iteration 2:** All four methods show a decrease in the proportion of correct answers at the second iteration compared to the first.
* **Convergence at Iteration 5:** By the final iteration, the performance of three methods (Generation, Correct Flip, Incorrect Flip) converges within a narrow band between 0.05 and 0.06. The Multiple-Choice method is a significant outlier, dropping to the lowest point on the chart (0.02).
* **Diverging Paths:** After the initial dip, the methods follow different trajectories. "Correct Flip" shows the most consistent improvement from iteration 2 onward. "Multiple-Choice" is the most volatile, with a notable peak at iteration 4 before its final drop.
* **Initial Similarity:** At iteration 1, three of the four methods (Multiple-Choice, Correct Flip, Incorrect Flip) start at nearly the same performance level (~0.09), while "Generation" starts slightly higher (~0.10).
### Interpretation
The chart suggests that the Qwen2.5-3B model's performance on a given task is highly sensitive to both the method used (Generation vs. Multiple-Choice vs. Flip strategies) and the iteration number. The universal dip at iteration 2 could indicate a common point of difficulty, a change in task parameters, or a phase where the model is "re-learning" or adjusting.
The "Correct Flip" strategy demonstrates the most robust recovery and improvement after the initial setback, suggesting it may be a more stable method for this specific task over multiple iterations. In contrast, the "Multiple-Choice" method, while peaking at iteration 4, ends as the worst performer, indicating it may be less reliable or more prone to degradation over repeated trials.
The convergence of three methods at iteration 5 implies that, given enough iterations, different approaches may lead to a similar, albeit modest, level of accuracy. The data highlights the importance of evaluating model performance across multiple iterations and methods, as a single snapshot (e.g., only at iteration 1 or 4) could give a misleading impression of overall capability. The low absolute values (all below 0.14) suggest the underlying task is challenging for this model.